Copyright
©2012 Baishideng Publishing Group Co.
World J Gastroenterol. Jan 28, 2012; 18(4): 375-382
Published online Jan 28, 2012. doi: 10.3748/wjg.v18.i4.375
Published online Jan 28, 2012. doi: 10.3748/wjg.v18.i4.375
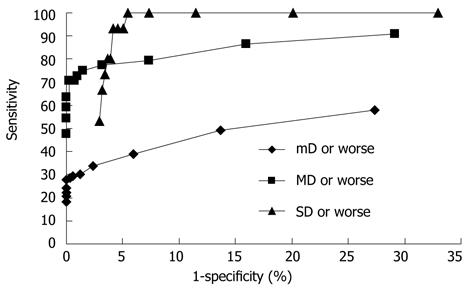
Figure 3 Receiver operating characteristics curves of DNA image cytometry based on histopathological results including mD or worse, MD and worse or SD or worse.
For each curve, the 15 points from right to left are from at least one aneuploid cell to at least 15 aneuploid cells. mD: Mild dysplasia; MD: Moderate dysplasia; SD: Severe dysplasia.
- Citation: Zhao L, Wei WQ, Zhao DL, Hao CQ, Lin DM, Pan QJ, Li XQ, Lei FH, Wang JW, Wang GQ, Shang Q, Qiao YL. Population-based study of DNA image cytometry as screening method for esophageal cancer. World J Gastroenterol 2012; 18(4): 375-382
- URL: https://www.wjgnet.com/1007-9327/full/v18/i4/375.htm
- DOI: https://dx.doi.org/10.3748/wjg.v18.i4.375


