Copyright
©2012 Baishideng Publishing Group Co.
World J Gastroenterol. Jan 28, 2012; 18(4): 368-374
Published online Jan 28, 2012. doi: 10.3748/wjg.v18.i4.368
Published online Jan 28, 2012. doi: 10.3748/wjg.v18.i4.368
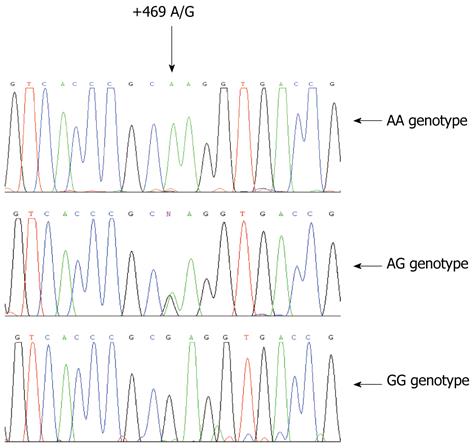
Figure 2 Sequence data of intercellular adhesion molecule-1 K469E genotype.
These three graphs represent AA, AG and GG genotypes.
- Citation: Tian MM, Sun Y, Li ZW, Wu Y, Zhao AL, Li JY. Polymorphisms of ICAM-1 are associated with gastric cancer risk and prognosis. World J Gastroenterol 2012; 18(4): 368-374
- URL: https://www.wjgnet.com/1007-9327/full/v18/i4/368.htm
- DOI: https://dx.doi.org/10.3748/wjg.v18.i4.368


