Copyright
©2012 Baishideng Publishing Group Co.
World J Gastroenterol. Jan 28, 2012; 18(4): 356-367
Published online Jan 28, 2012. doi: 10.3748/wjg.v18.i4.356
Published online Jan 28, 2012. doi: 10.3748/wjg.v18.i4.356
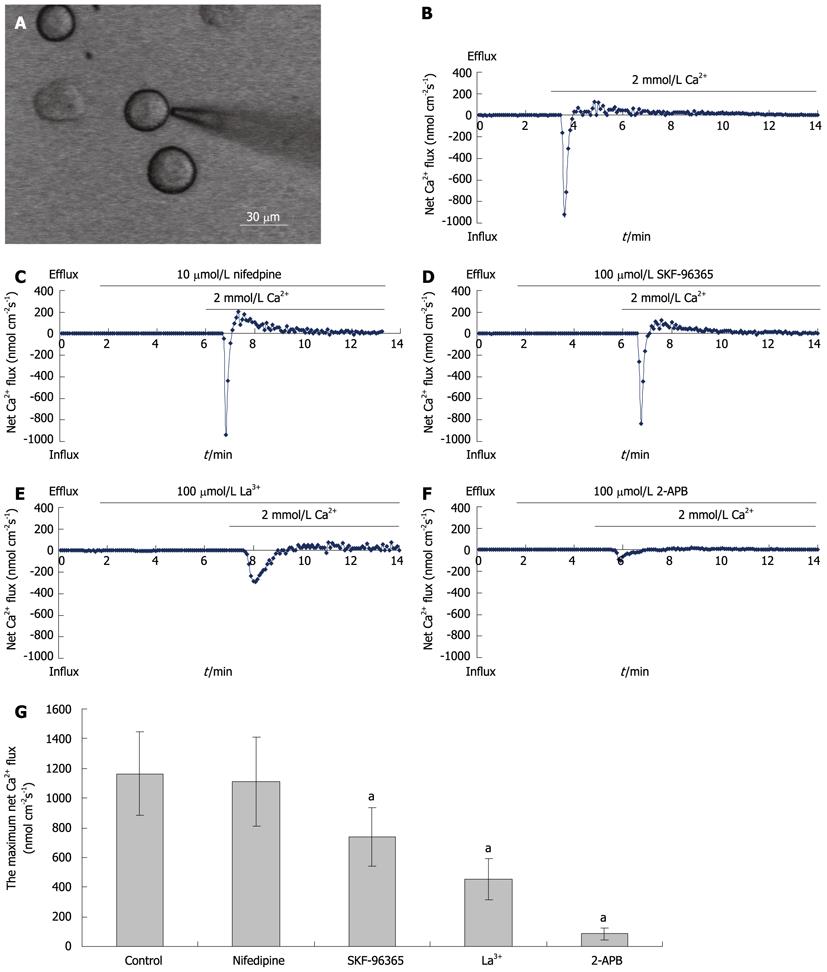
Figure 3 Ca2+ flux in freshly isolated hepatocytes.
A: A screen-printed picture of a cell measured by NMT; B-F: Net Ca2+ fluxes of a freshly isolated rat hepatocyte (B) and repeated in the presence of 10 μmol/L nifedipine (C), 100 μmol/L SKF-96365 (D), 100 μmol/L La3+ (E), and 100 μmol/L 2-APB (F); G: Bar graph of the maximum net Ca2+ fluxes in five groups. aP < 0.01, control group vs SKF-96365, La3+ or 2-APB group. 2-APB: 2-aminoethoxydiphenyl borate.
- Citation: Pan LJ, Zhang ZC, Zhang ZY, Wang WJ, Xu Y, Zhang ZM. Effects and mechanisms of store-operated calcium channel blockade on hepatic ischemia-reperfusion injury in rats. World J Gastroenterol 2012; 18(4): 356-367
- URL: https://www.wjgnet.com/1007-9327/full/v18/i4/356.htm
- DOI: https://dx.doi.org/10.3748/wjg.v18.i4.356


