Copyright
©2012 Baishideng Publishing Group Co.
World J Gastroenterol. Oct 21, 2012; 18(39): 5581-5588
Published online Oct 21, 2012. doi: 10.3748/wjg.v18.i39.5581
Published online Oct 21, 2012. doi: 10.3748/wjg.v18.i39.5581
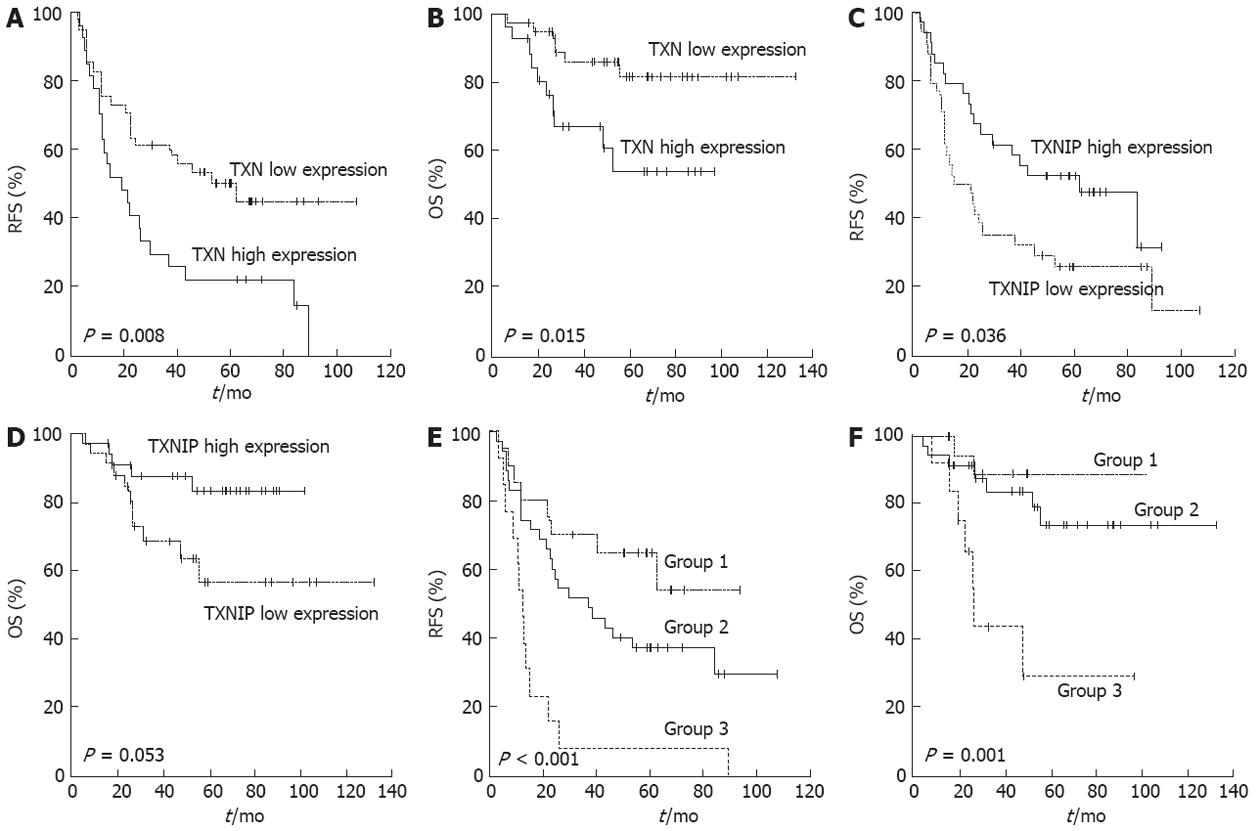
Figure 2 Kaplan-Meier plot of recurrence-free survival and overall survival according to gene expression.
Gene expression was measured using quantitative reverse transcription-polymerase chain reaction. Stage III gastric cancer patients were divided into two or three groups according to their gene expression levels. A, B: Survival curves according to thioredoxin (TXN) expression level; C, D: Survival curves according to thioredoxin-interacting protein (TXNIP) expression levels; E, F: Survival curves according to the combination of the TXN and TXNIP expression levels (Group 1: Simultaneous low TXN and high TXNIP expression; Group 2: Neither group 1 nor group 3; Group 3: Simultaneous high TXN and low TXNIP expression). The prognosis was compared across the groups using the log-rank test.
- Citation: Lim JY, Yoon SO, Hong SW, Kim JW, Choi SH, Cho JY. Thioredoxin and thioredoxin-interacting protein as prognostic markers for gastric cancer recurrence. World J Gastroenterol 2012; 18(39): 5581-5588
- URL: https://www.wjgnet.com/1007-9327/full/v18/i39/5581.htm
- DOI: https://dx.doi.org/10.3748/wjg.v18.i39.5581


