Copyright
©2012 Baishideng Publishing Group Co.
World J Gastroenterol. Oct 14, 2012; 18(38): 5454-5461
Published online Oct 14, 2012. doi: 10.3748/wjg.v18.i38.5454
Published online Oct 14, 2012. doi: 10.3748/wjg.v18.i38.5454
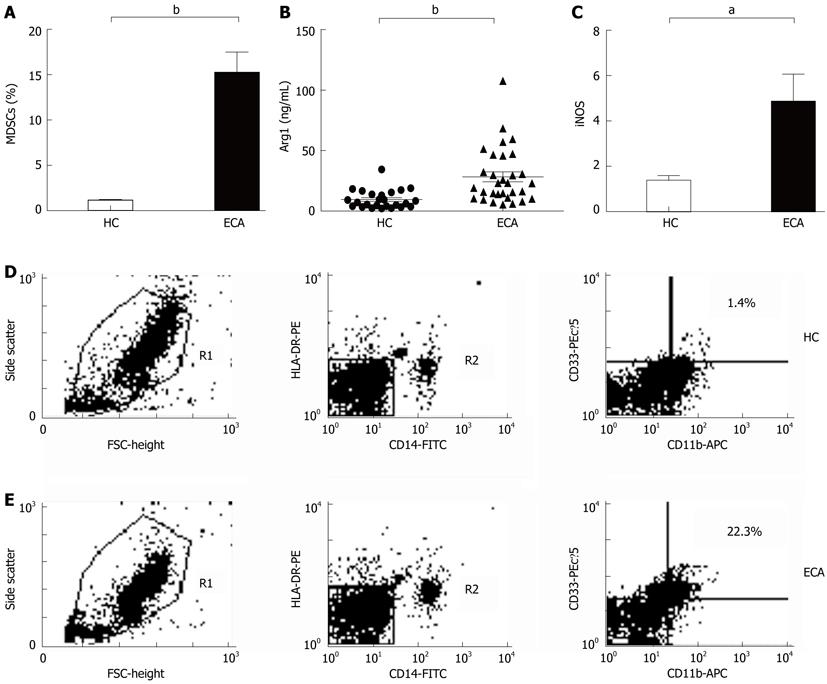
Figure 1 Elevated levels of myeloid-derived suppressor cells and their products, arginase 1 and inducible NO synthase, in esophageal cancer compared with healthy controls.
A: Flow cytometric analysis of MDSCs in the peripheral blood from ECA patients and healthy control (HC); B: Plasma arginase 1 (Arg1) level was determined by ELISA; C: The mRNA level of iNOS in the peripheral blood from ECA patients and HC were assessed by real-time PCR; D: Representative flow diagrams of a healthy volunteer with marked elevation of circulating MDSCs; E: Representative flow diagrams of an ECA patient with marked elevation of circulating MDSCs are shown. Data were analyzed by the Student’s t-test. aP < 0.05, bP < 0.01 vs HC group. ECA: Esophageal cancer; MDSCs: Myeloid-derived suppressor cells; ELISA: Enzyme linked immunosorbent assay; iNOS: Inducible NO synthase; PCR: Polymerase chain reaction; FITC: Fluorescein isothiocyanate; FSC: Forward scatter; HLA-DR-PE: HLA-DR-phycoerythrin; APC: Allophycocyanin.
- Citation: Jiao ZJ, Gao JJ, Hua SH, Chen DY, Wang WH, Wang H, Wang XH, Xu HX. Correlation between circulating myeloid-derived suppressor cells and Th17 cells in esophageal cancer. World J Gastroenterol 2012; 18(38): 5454-5461
- URL: https://www.wjgnet.com/1007-9327/full/v18/i38/5454.htm
- DOI: https://dx.doi.org/10.3748/wjg.v18.i38.5454


