Copyright
©2012 Baishideng Publishing Group Co.
World J Gastroenterol. Oct 14, 2012; 18(38): 5404-5411
Published online Oct 14, 2012. doi: 10.3748/wjg.v18.i38.5404
Published online Oct 14, 2012. doi: 10.3748/wjg.v18.i38.5404
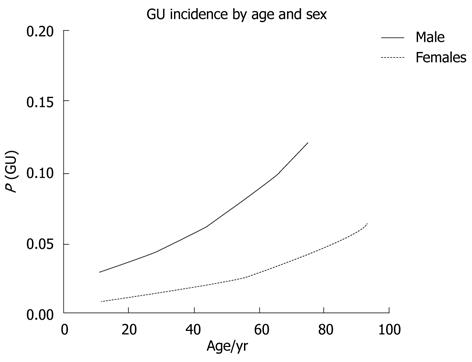
Figure 2 Logistic regression curves of age and sex as independent factors to explain gastric ulcer disease incidence.
The model has a significant fit, with contributions of both coefficients (χ2 = 30.5, P < 0.0001). Additional test for the age/sex interaction had a nonsignificant result (β3 = -0.011, SE = 0.0161, P = 0.4844, OR = 0.989, CI- = 0.958, CI+ = 1.021). OR: Odds ratios; CI: Confidence intervals; GU: Gastric ulcer.
- Citation: Suzuki RB, Cola RF, Cola LTB, Ferrari CG, Ellinger F, Therezo AL, Silva LC, Eterovic A, Sperança MA. Different risk factors influence peptic ulcer disease development in a Brazilian population. World J Gastroenterol 2012; 18(38): 5404-5411
- URL: https://www.wjgnet.com/1007-9327/full/v18/i38/5404.htm
- DOI: https://dx.doi.org/10.3748/wjg.v18.i38.5404


