Copyright
©2012 Baishideng Publishing Group Co.
World J Gastroenterol. Oct 7, 2012; 18(37): 5197-5204
Published online Oct 7, 2012. doi: 10.3748/wjg.v18.i37.5197
Published online Oct 7, 2012. doi: 10.3748/wjg.v18.i37.5197
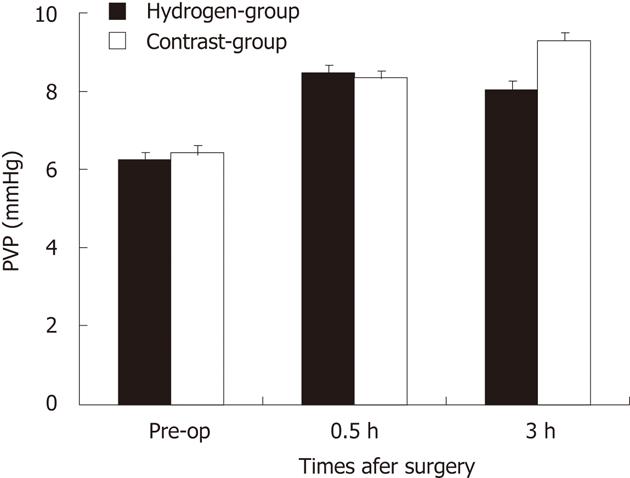
Figure 1 Serial changes of portal vein pressure in two groups.
A bar graph shows the mean ± SD of portal vein pressure (PVP) (mmHg) in the two groups. Each group is represented by the mean of 7 swines. There was no significant difference in changes of PVP between two groups at the pre-operation (pre-op), 0.5 h and 3 h.
- Citation: Xiang L, Tan JW, Huang LJ, Jia L, Liu YQ, Zhao YQ, Wang K, Dong JH. Inhalation of hydrogen gas reduces liver injury during major hepatotectomy in swine. World J Gastroenterol 2012; 18(37): 5197-5204
- URL: https://www.wjgnet.com/1007-9327/full/v18/i37/5197.htm
- DOI: https://dx.doi.org/10.3748/wjg.v18.i37.5197


