Copyright
©2012 Baishideng Publishing Group Co.
World J Gastroenterol. Sep 28, 2012; 18(36): 5027-5033
Published online Sep 28, 2012. doi: 10.3748/wjg.v18.i36.5027
Published online Sep 28, 2012. doi: 10.3748/wjg.v18.i36.5027
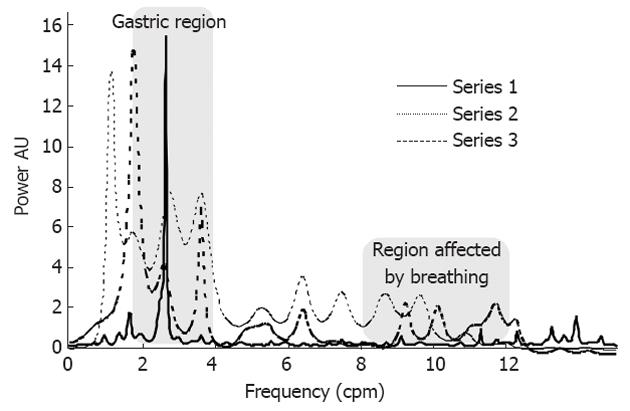
Figure 2 Typical frequency spectrum of the electrical bio-impedance gastric signal.
The three curves show the typical changes during the tests (Stroop Test in this example): series 1: solid line, before the test; series 2: dotted line, during the test; series 3: dashed line after the test. AU: Arbitrary units.
- Citation: Huerta-Franco MR, Vargas-Luna M, Montes-Frausto JB, Morales-Mata I, Ramirez-Padilla L. Effect of psychological stress on gastric motility assessed by electrical bio-impedance. World J Gastroenterol 2012; 18(36): 5027-5033
- URL: https://www.wjgnet.com/1007-9327/full/v18/i36/5027.htm
- DOI: https://dx.doi.org/10.3748/wjg.v18.i36.5027


