Copyright
©2012 Baishideng Publishing Group Co.
World J Gastroenterol. Sep 21, 2012; 18(35): 4875-4884
Published online Sep 21, 2012. doi: 10.3748/wjg.v18.i35.4875
Published online Sep 21, 2012. doi: 10.3748/wjg.v18.i35.4875
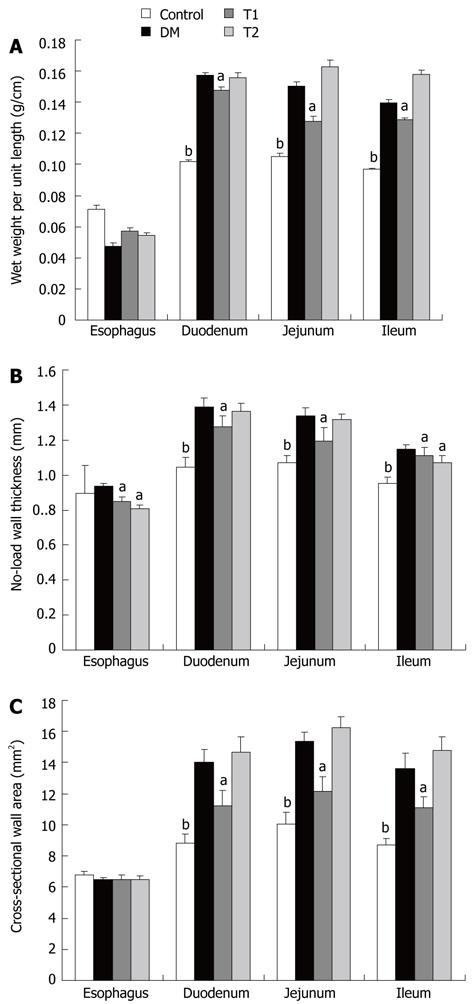
Figure 3 Wet weight per unit length, wall thickness and wall area in different segments of the different groups.
A: Wet weight per unit length; B: Wall thickness; C: Wall area. aP < 0.05, bP < 0.01 vs DM group. DM: Diabetic control; T1: High dose; T2: Low dose.
- Citation: Liu GF, Zhao JB, Zhen Z, Sha H, Chen PM, Li M, Zhang JC, Yuan MZ, Gao W, Gregersen H, Tong XL. Effect of Tangweian Jianji on upper gastrointestinal remodeling in streptozotocin-induced diabetic rats. World J Gastroenterol 2012; 18(35): 4875-4884
- URL: https://www.wjgnet.com/1007-9327/full/v18/i35/4875.htm
- DOI: https://dx.doi.org/10.3748/wjg.v18.i35.4875


