Copyright
©2012 Baishideng Publishing Group Co.
World J Gastroenterol. Sep 14, 2012; 18(34): 4781-4786
Published online Sep 14, 2012. doi: 10.3748/wjg.v18.i34.4781
Published online Sep 14, 2012. doi: 10.3748/wjg.v18.i34.4781
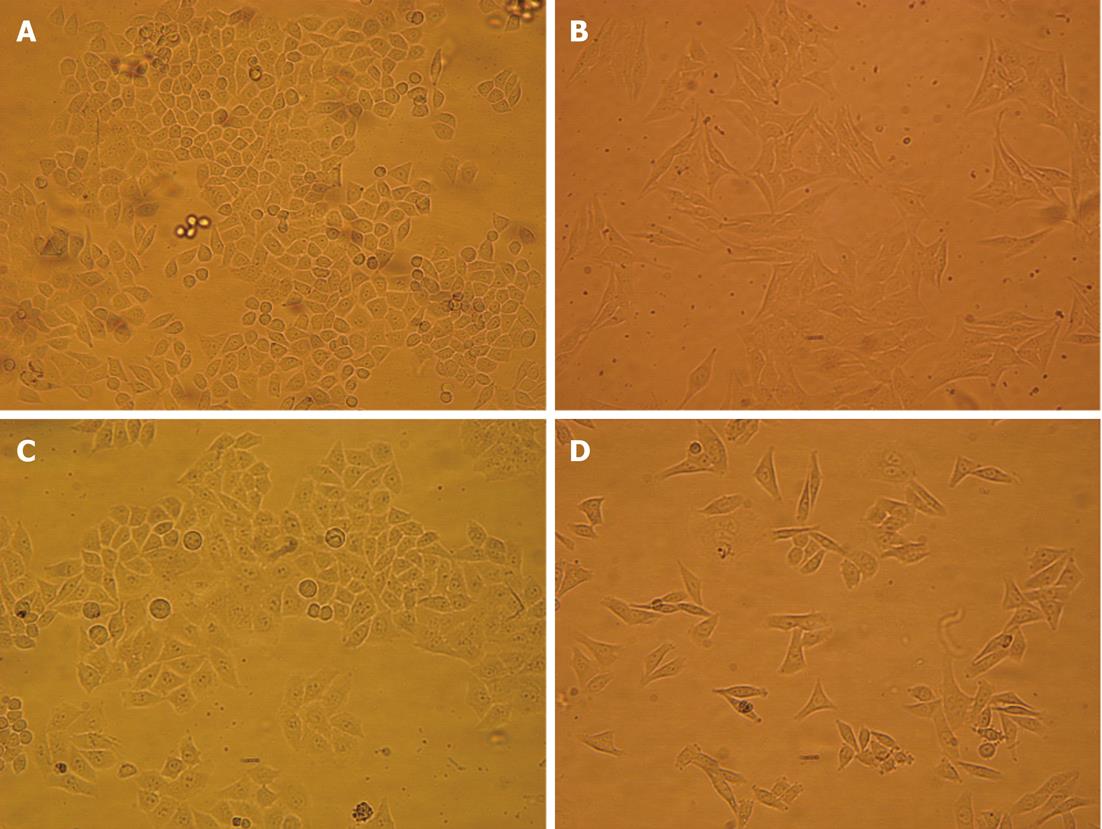
Figure 1 Morphologic changes after hyperthermia or hypoxia treatment in HepG2 cells.
A: Cells were cutured in 21% O2 for 72 h; B: Cells were cultured in 1.0% O2 for 72 h; C: Cells were treated with hyperthermia at 43 °C for 0.5 h, followed by treatment with normoxia; D: Cells were treated with hyperthermia at 43 °C for 0.5 h, followed by treatment with hypoxia.
- Citation: Yuan GJ, Li QW, Shan SL, Wang WM, Jiang S, Xu XM. Hyperthermia inhibits hypoxia-induced epithelial-mesenchymal transition in HepG2 hepatocellular carcinoma cells. World J Gastroenterol 2012; 18(34): 4781-4786
- URL: https://www.wjgnet.com/1007-9327/full/v18/i34/4781.htm
- DOI: https://dx.doi.org/10.3748/wjg.v18.i34.4781


