Copyright
©2012 Baishideng Publishing Group Co.
World J Gastroenterol. Sep 14, 2012; 18(34): 4693-4703
Published online Sep 14, 2012. doi: 10.3748/wjg.v18.i34.4693
Published online Sep 14, 2012. doi: 10.3748/wjg.v18.i34.4693
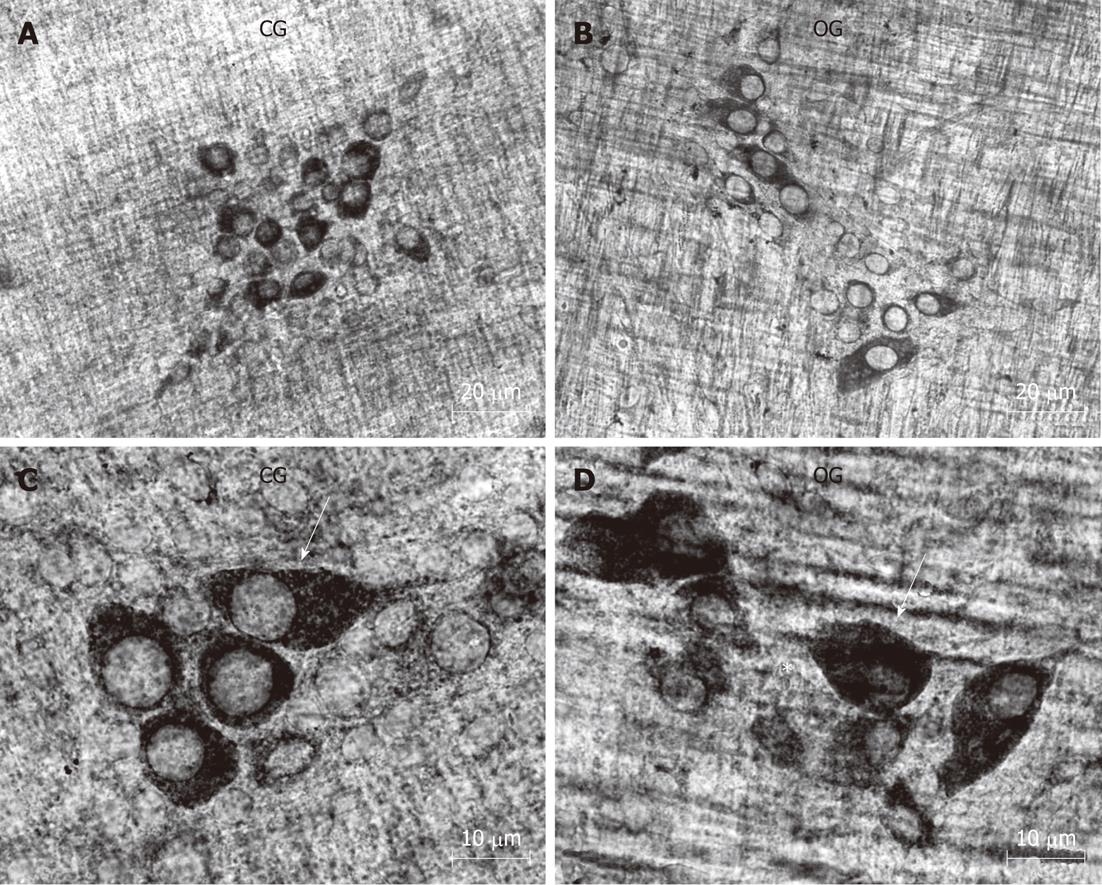
Figure 6 Ileum myenteric neurons labeled for nicotinamide adenine dinucleotide-diaphorase activity in the control group (A, C) and the obese group (C, D), and spaces between the neurons (asterisk) in the obese group group (B, D).
Arrows show stained myenteric neurons. CG: Control group; OG: Obese group.
- Citation: Mizuno MS, Crisma AR, Borelli P, Castelucci P. Expression of the P2X2 receptor in different classes of ileum myenteric neurons in the female obese ob/ob mouse. World J Gastroenterol 2012; 18(34): 4693-4703
- URL: https://www.wjgnet.com/1007-9327/full/v18/i34/4693.htm
- DOI: https://dx.doi.org/10.3748/wjg.v18.i34.4693


