Copyright
©2012 Baishideng Publishing Group Co.
World J Gastroenterol. Sep 14, 2012; 18(34): 4693-4703
Published online Sep 14, 2012. doi: 10.3748/wjg.v18.i34.4693
Published online Sep 14, 2012. doi: 10.3748/wjg.v18.i34.4693
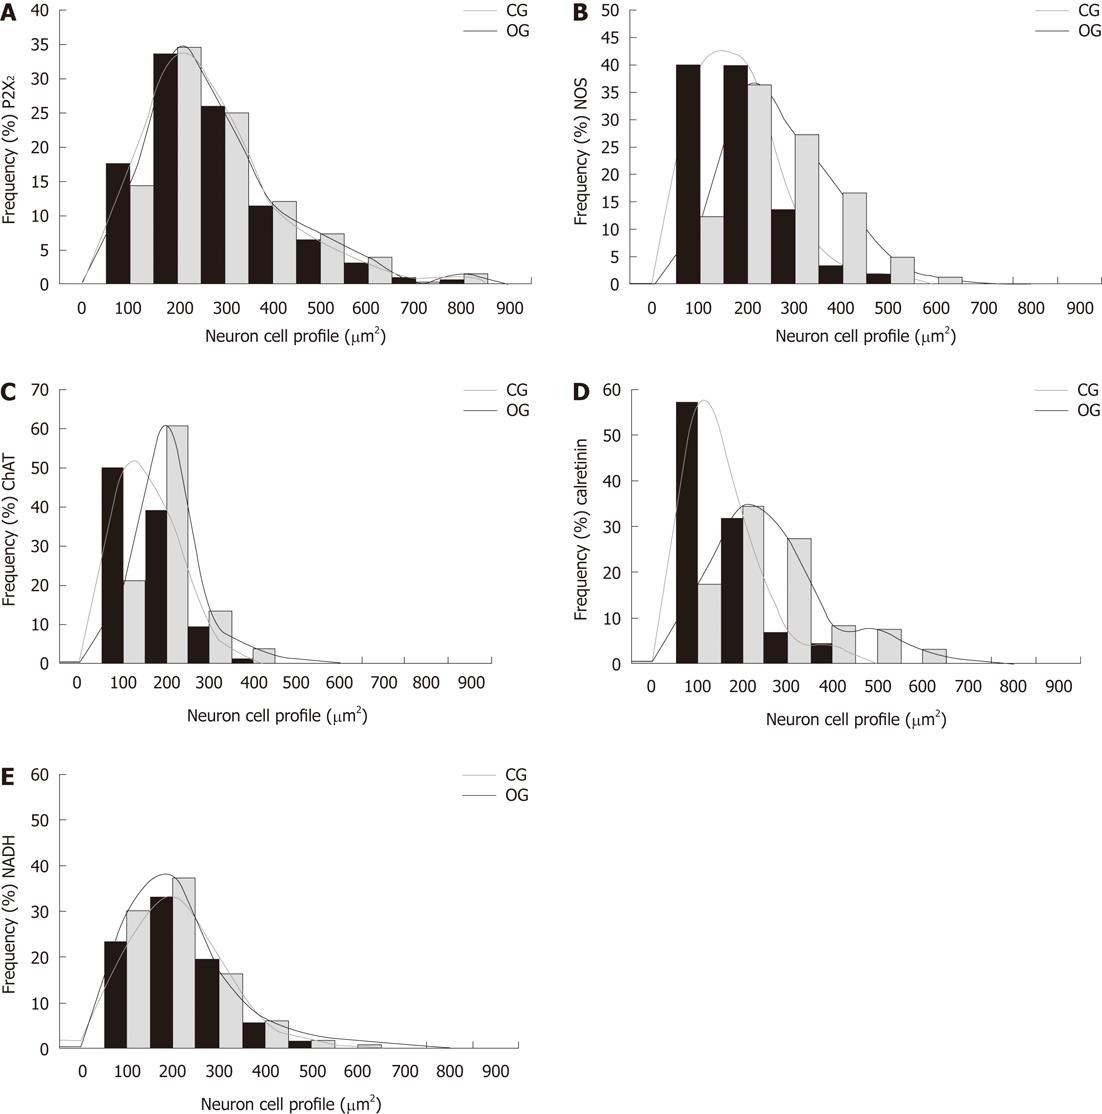
Figure 5 Frequency distribution of neuronal size profiles (μm2) for neurons immunoreactive for P2X2 receptor (A), nitric oxide synthase (B), choline acetyltransferase (C), calretinin (D), and positive for nicotinamide adenine dinucleotide-diaphorase (E) in the ileum myenteric plexus of control (black bars) and obese (grey bars) groups.
NOS: Nitric oxide synthase; ChAT: Choline acetyltransferase; NADH: Nicotinamide adenine dinucleotide; CG: Control group; OG: Obese group.
- Citation: Mizuno MS, Crisma AR, Borelli P, Castelucci P. Expression of the P2X2 receptor in different classes of ileum myenteric neurons in the female obese ob/ob mouse. World J Gastroenterol 2012; 18(34): 4693-4703
- URL: https://www.wjgnet.com/1007-9327/full/v18/i34/4693.htm
- DOI: https://dx.doi.org/10.3748/wjg.v18.i34.4693


