Copyright
©2012 Baishideng Publishing Group Co.
World J Gastroenterol. Sep 7, 2012; 18(33): 4585-4592
Published online Sep 7, 2012. doi: 10.3748/wjg.v18.i33.4585
Published online Sep 7, 2012. doi: 10.3748/wjg.v18.i33.4585
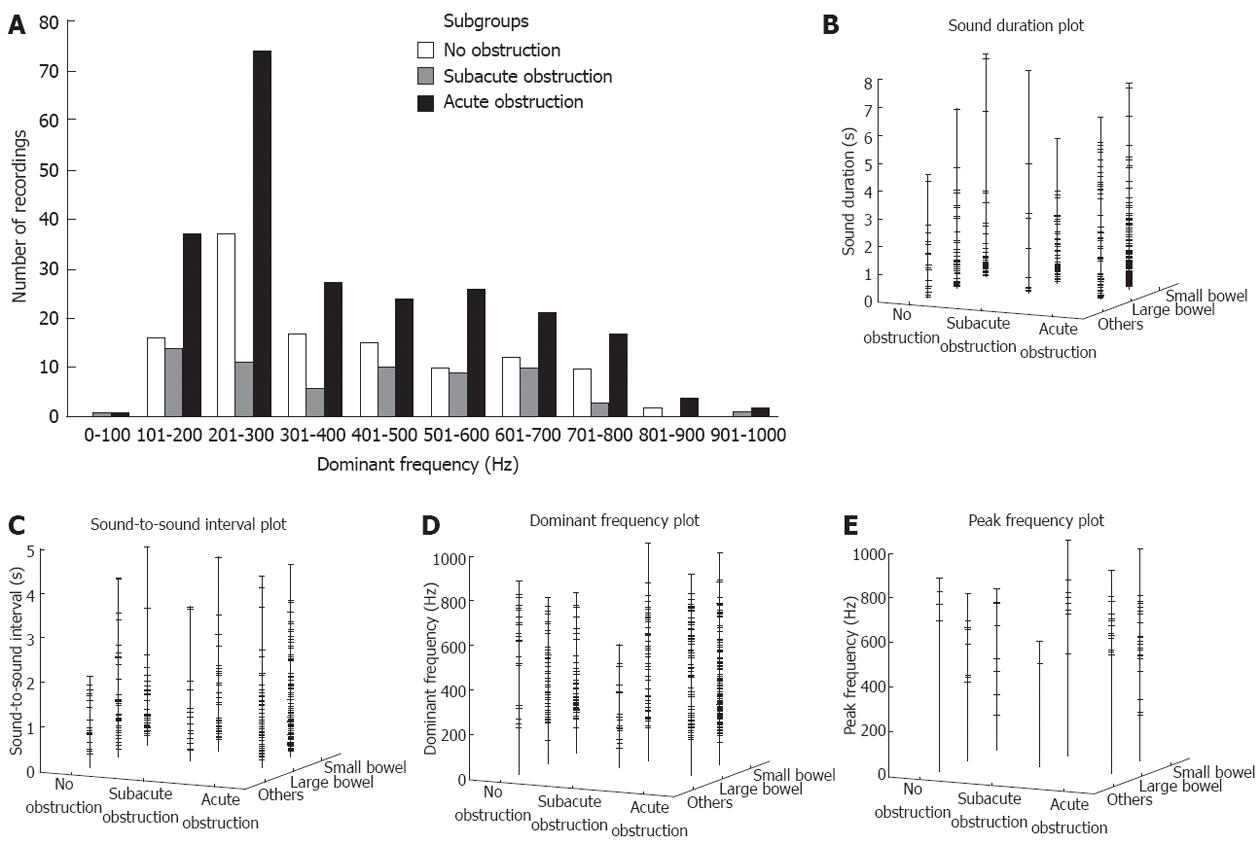
Figure 5 Distribution of the dominant frequencies of bowel sounds (A), sound duration (B), sound-to-sound interval (C), dominant frequency (D), and peak frequency (E) in patients with no obstruction, subacute obstruction, and acute obstruction, etc.
- Citation: Ching SS, Tan YK. Spectral analysis of bowel sounds in intestinal obstruction using an electronic stethoscope. World J Gastroenterol 2012; 18(33): 4585-4592
- URL: https://www.wjgnet.com/1007-9327/full/v18/i33/4585.htm
- DOI: https://dx.doi.org/10.3748/wjg.v18.i33.4585


