Copyright
©2012 Baishideng Publishing Group Co.
World J Gastroenterol. Sep 7, 2012; 18(33): 4585-4592
Published online Sep 7, 2012. doi: 10.3748/wjg.v18.i33.4585
Published online Sep 7, 2012. doi: 10.3748/wjg.v18.i33.4585
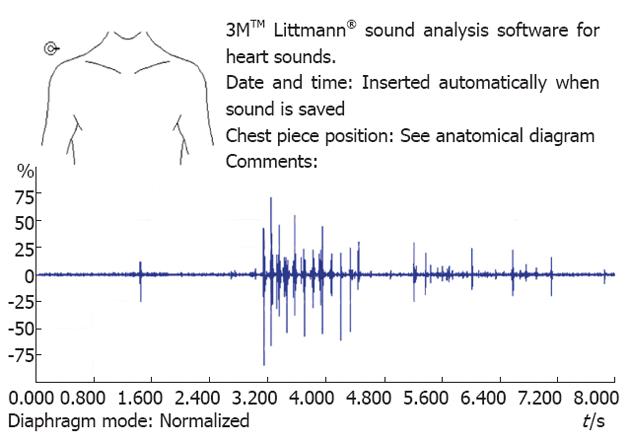
Figure 1 Example of bowel sound recording displayed in the “waveform” view.
The y-axis indicates the relative sound amplitude and the x-axis indicates recording time elapsed in seconds. This recording was taken from a patient with a small bowel obstruction. Note the isolated sound on the left side followed by two clusters of sound in the middle and on right side of the strip.
- Citation: Ching SS, Tan YK. Spectral analysis of bowel sounds in intestinal obstruction using an electronic stethoscope. World J Gastroenterol 2012; 18(33): 4585-4592
- URL: https://www.wjgnet.com/1007-9327/full/v18/i33/4585.htm
- DOI: https://dx.doi.org/10.3748/wjg.v18.i33.4585


