Copyright
©2012 Baishideng Publishing Group Co.
World J Gastroenterol. Sep 7, 2012; 18(33): 4522-4532
Published online Sep 7, 2012. doi: 10.3748/wjg.v18.i33.4522
Published online Sep 7, 2012. doi: 10.3748/wjg.v18.i33.4522
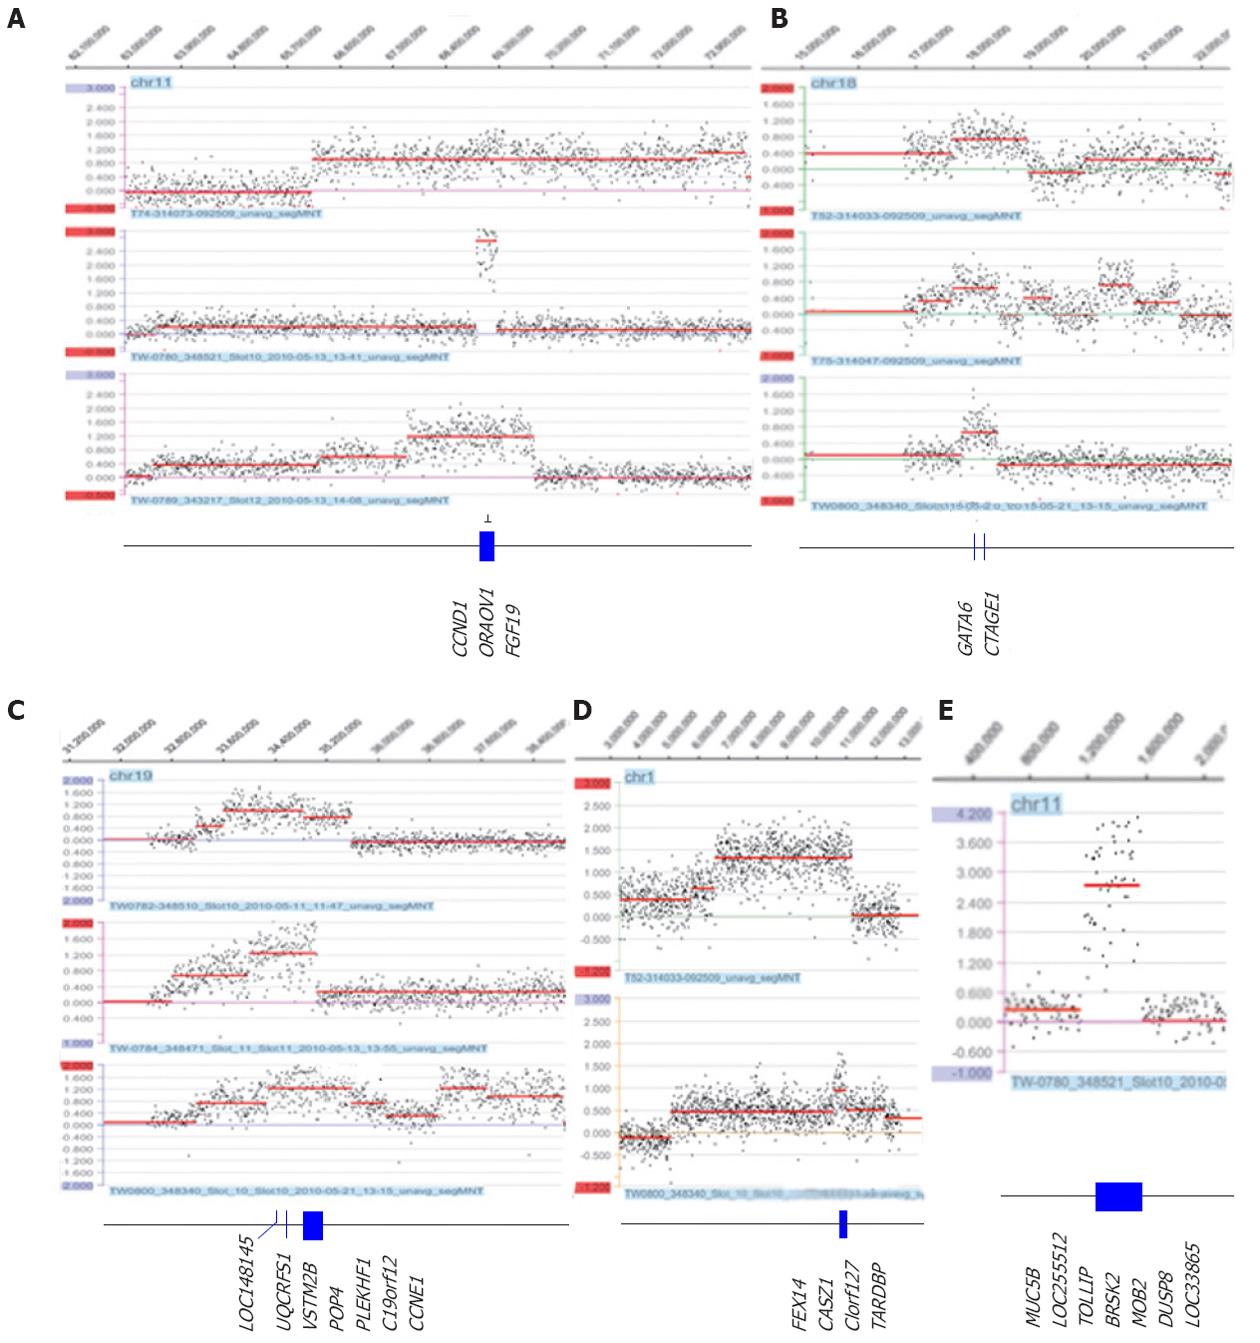
Figure 2 Representative amplifications detected by array comparative genomic hybridization and the genes that are located in the smallest region of overlap.
The most common amplicons at 11q13 (A), 18q11.2 (B) and 19q12 (C) and novel amplicons at 1p36.22 (D) and 11p15.5 (E) region (log2 > 0.5). The x-axis indicates the genomic location, and the y-axis indicates the log2 ratio.
- Citation: Liu YY, Chen HY, Zhang ML, Tian D, Li S, Lee JY. Loss of fragile histidine triad and amplification of 1p36.22 and 11p15.5 in primary gastric adenocarcinomas. World J Gastroenterol 2012; 18(33): 4522-4532
- URL: https://www.wjgnet.com/1007-9327/full/v18/i33/4522.htm
- DOI: https://dx.doi.org/10.3748/wjg.v18.i33.4522


