Copyright
©2012 Baishideng Publishing Group Co.
World J Gastroenterol. Aug 28, 2012; 18(32): 4427-4434
Published online Aug 28, 2012. doi: 10.3748/wjg.v18.i32.4427
Published online Aug 28, 2012. doi: 10.3748/wjg.v18.i32.4427
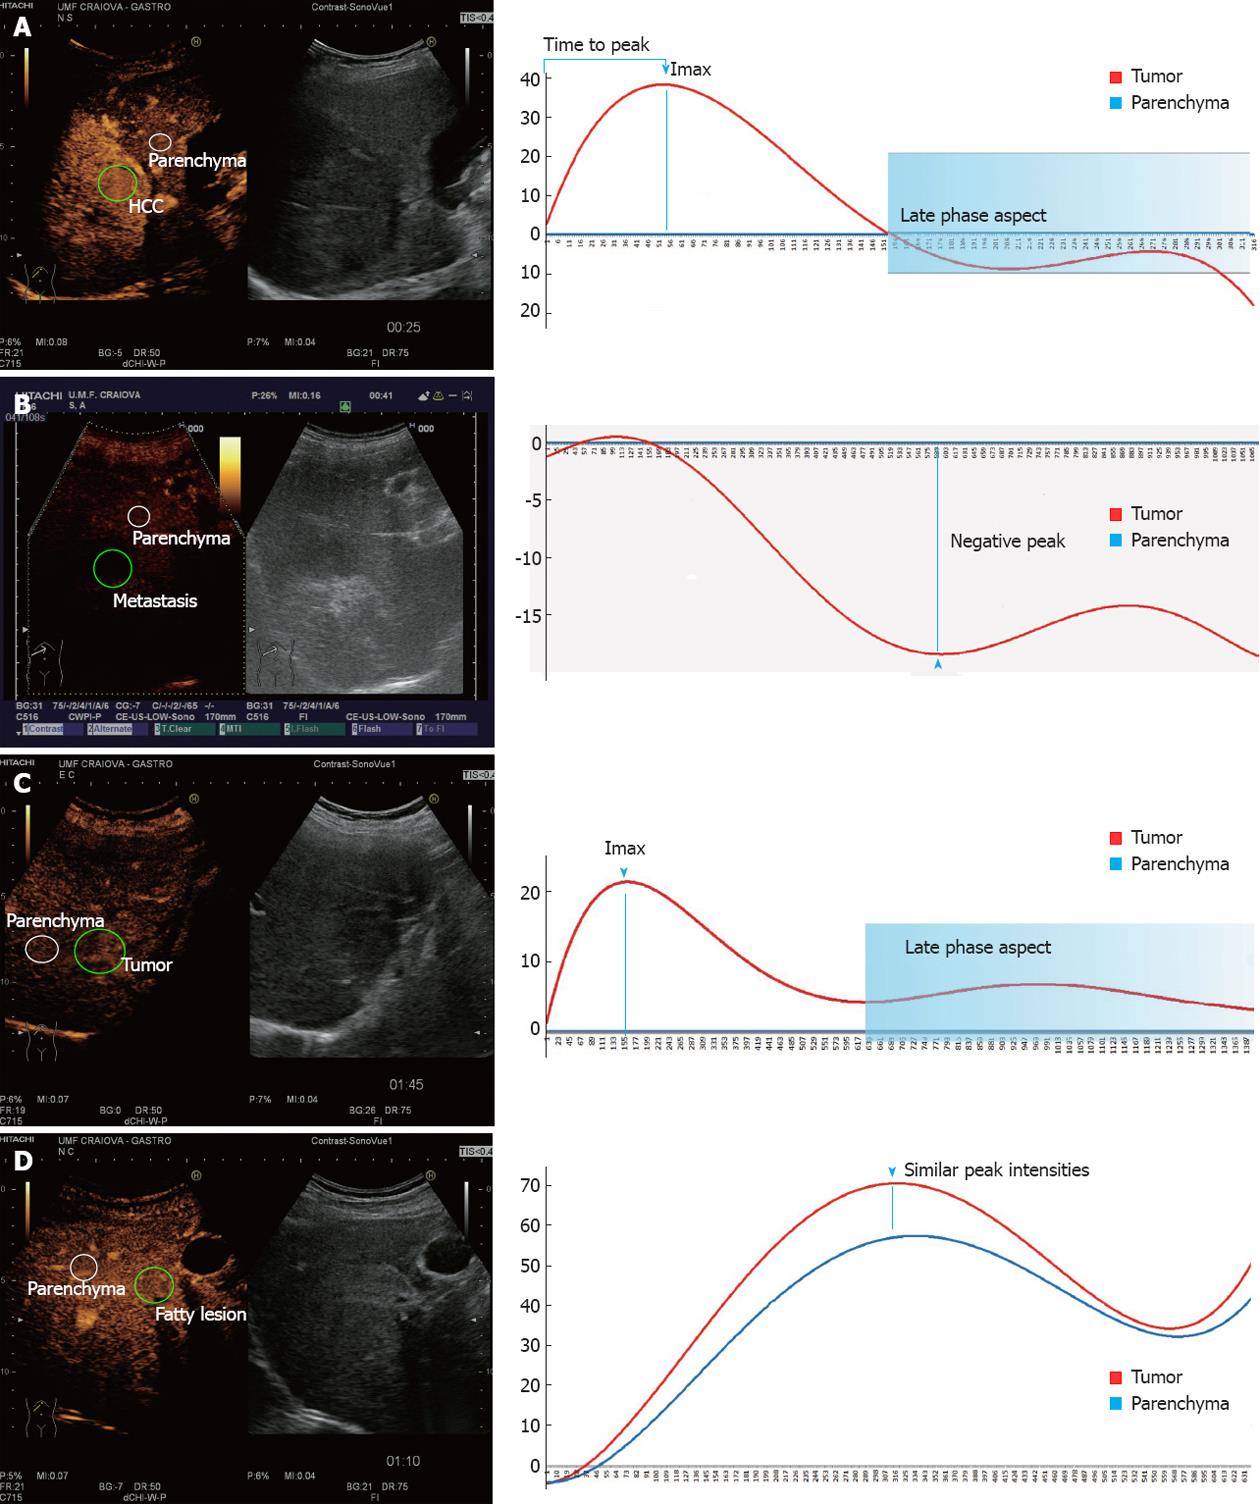
Figure 3 Examples of contrast-enhanced ultrasonography aspects and the selection of the two regions of interest, corresponding to the liver tumor and normal parenchyma, respectively.
Graphical representation of the time-intensity curve (TIC) and the most important parameters extracted and later fed to the artificial neural networks. A: Hepatocellular carcinoma (HCC)-positive contrast uptake in the early arterial phase followed by wash-out in the portal/late phase; B: Hypovascular metastasis-hypoenhancement of the tumor compared to normal parenchyma; C: Hepatic hemangyoma-absence of the wash-out and positive peak intensity; D: Focal fatty change-similar TIC parameters for the two selected areas of interest.
- Citation: Streba CT, Ionescu M, Gheonea DI, Sandulescu L, Ciurea T, Saftoiu A, Vere CC, Rogoveanu I. Contrast-enhanced ultrasonography parameters in neural network diagnosis of liver tumors. World J Gastroenterol 2012; 18(32): 4427-4434
- URL: https://www.wjgnet.com/1007-9327/full/v18/i32/4427.htm
- DOI: https://dx.doi.org/10.3748/wjg.v18.i32.4427


