Copyright
©2012 Baishideng Publishing Group Co.
World J Gastroenterol. Aug 28, 2012; 18(32): 4270-4277
Published online Aug 28, 2012. doi: 10.3748/wjg.v18.i32.4270
Published online Aug 28, 2012. doi: 10.3748/wjg.v18.i32.4270
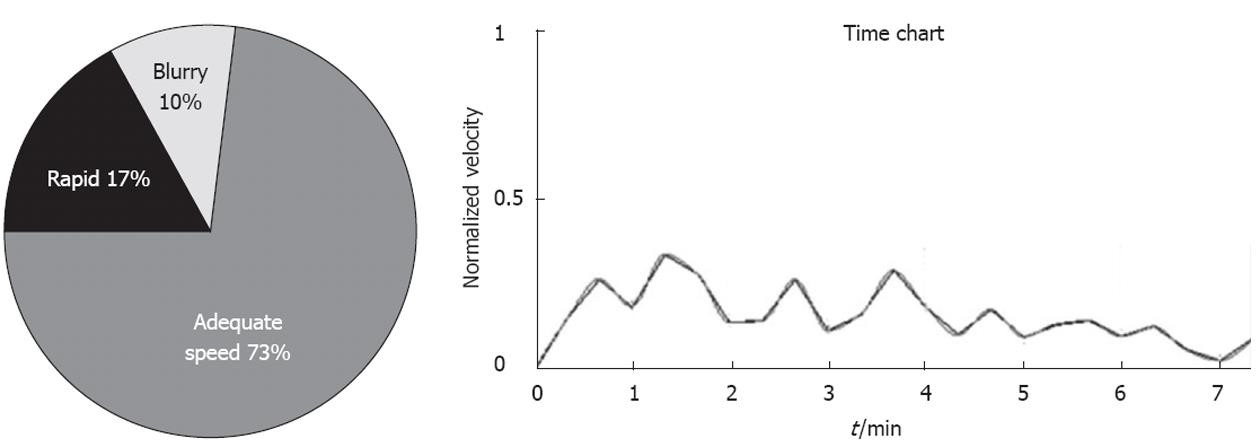
Figure 4 An automatically generated chart providing % of time of adequate speed in a colonoscopy procedure (left) and chart showing filtered velocity over time (right).
- Citation: Filip D, Gao X, Angulo-Rodríguez L, Mintchev MP, Devlin SM, Rostom A, Rosen W, Andrews CN. Colometer: A real-time quality feedback system for screening colonoscopy. World J Gastroenterol 2012; 18(32): 4270-4277
- URL: https://www.wjgnet.com/1007-9327/full/v18/i32/4270.htm
- DOI: https://dx.doi.org/10.3748/wjg.v18.i32.4270


