Copyright
©2012 Baishideng Publishing Group Co.
World J Gastroenterol. Aug 14, 2012; 18(30): 3962-3976
Published online Aug 14, 2012. doi: 10.3748/wjg.v18.i30.3962
Published online Aug 14, 2012. doi: 10.3748/wjg.v18.i30.3962
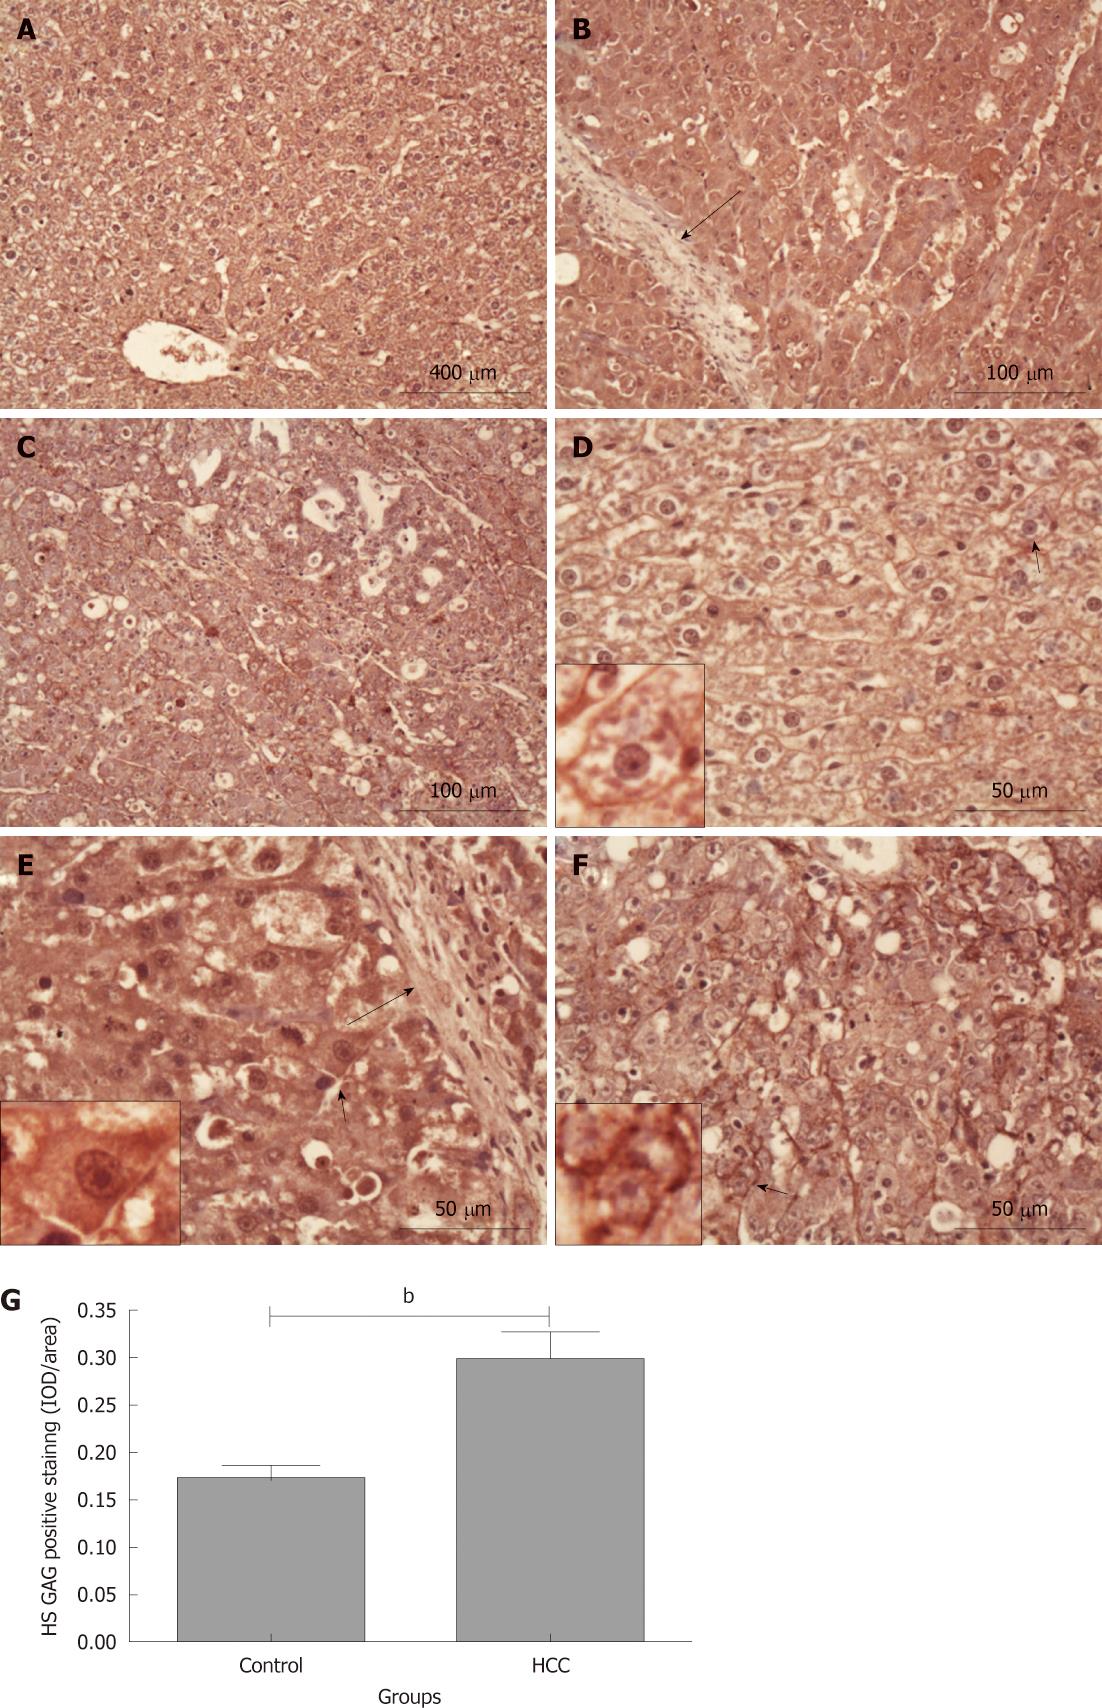
Figure 4 Heparan sulphate glycosaminoglycan staining in rat liver tissues.
Heparan sulphate (HS) glycosaminoglycan (GAG) content in tissue was stained using 10E4 antibody (dark red). A and D: Control group; B and E: Hepatocellular carcinoma (HCC) tissues with intensive HS GAG staining; C and F: HCC tissues with relative weaker HS GAG staining. Long black arrows: Fibrous tissue septa; short black arrows: The cells are magnified in the small boxes; G: Comparison of the average integrated optical density (IOD) in HS GAG positive staining in liver tissues between the control and HCC model groups (bP < 0.01). IOD/area: Integrated optical density per stained area.
- Citation: Jia XL, Li SY, Dang SS, Cheng YA, Zhang X, Wang WJ, Hughes CE, Caterson B. Increased expression of chondroitin sulphate proteoglycans in rat hepatocellular carcinoma tissues. World J Gastroenterol 2012; 18(30): 3962-3976
- URL: https://www.wjgnet.com/1007-9327/full/v18/i30/3962.htm
- DOI: https://dx.doi.org/10.3748/wjg.v18.i30.3962


