Copyright
©2012 Baishideng Publishing Group Co.
World J Gastroenterol. Aug 14, 2012; 18(30): 3962-3976
Published online Aug 14, 2012. doi: 10.3748/wjg.v18.i30.3962
Published online Aug 14, 2012. doi: 10.3748/wjg.v18.i30.3962
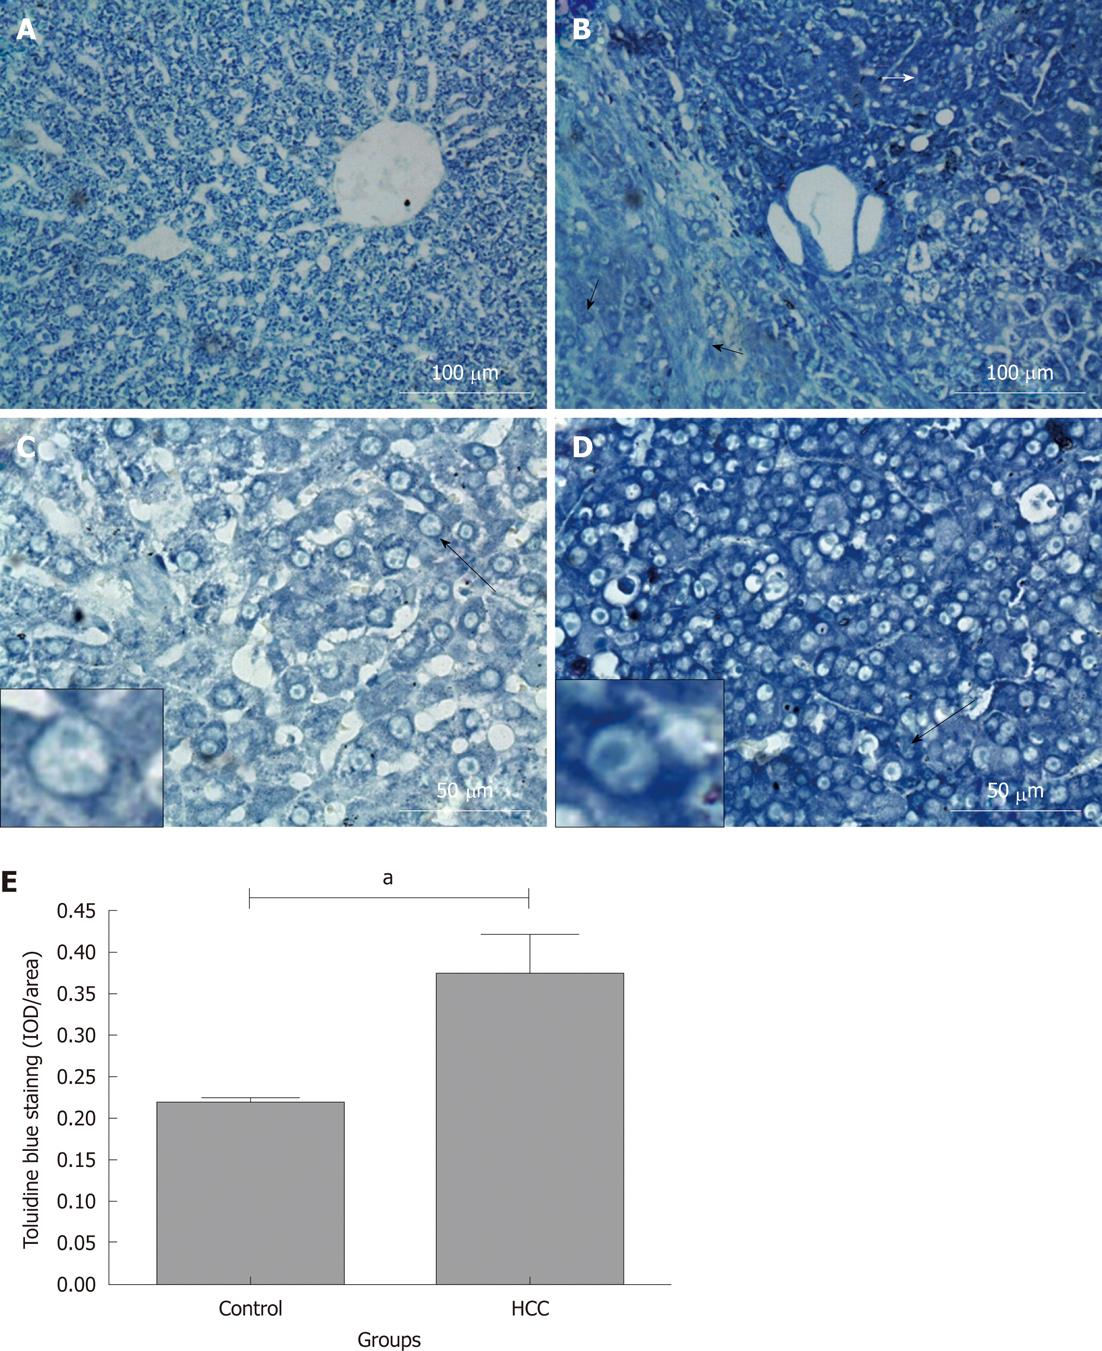
Figure 2 Toluidine blue staining in rat liver tissue sections.
Rats were treated with N-diethylnitrosamine for 16 wk to establish a hepatocellular carcinoma (HCC) animal model. Sulphated glycosaminoglycan content in tissues were stained with Toluidine blue. A and C: Control group; B and D: HCC model group. Long black arrows: The cells are magnified in the small boxes. Short white arrow: Hepatoma tissues with intensive Toluidine blue staining; short black arrow: Weaker Toluidine blue staining fibrosis and “relative normal” liver tissues adjacent to the hepatoma nodules; E: Comparison of average integrated optical density (IOD) of toluidine blue staining in liver tissue between control and HCC model group (aP < 0.05). IOD/area: Integrated optical density per stained area.
- Citation: Jia XL, Li SY, Dang SS, Cheng YA, Zhang X, Wang WJ, Hughes CE, Caterson B. Increased expression of chondroitin sulphate proteoglycans in rat hepatocellular carcinoma tissues. World J Gastroenterol 2012; 18(30): 3962-3976
- URL: https://www.wjgnet.com/1007-9327/full/v18/i30/3962.htm
- DOI: https://dx.doi.org/10.3748/wjg.v18.i30.3962


