Copyright
©2012 Baishideng Publishing Group Co.
World J Gastroenterol. Jul 21, 2012; 18(27): 3623-3626
Published online Jul 21, 2012. doi: 10.3748/wjg.v18.i27.3623
Published online Jul 21, 2012. doi: 10.3748/wjg.v18.i27.3623
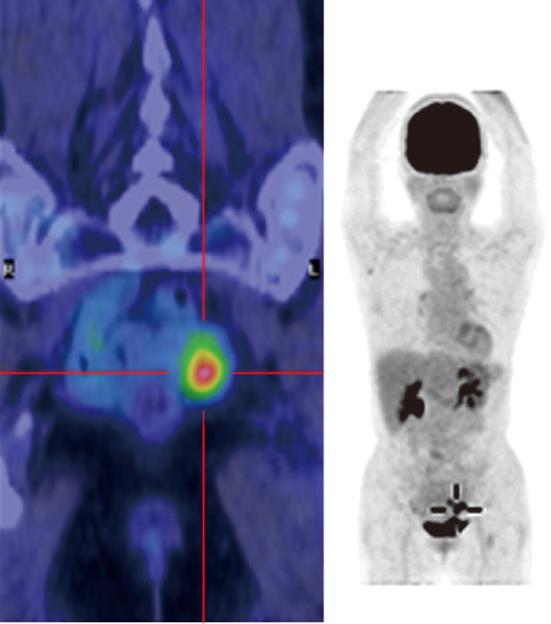
Figure 2 Fluorodeoxyglucose-positron emission tomography computed tomography imaging.
A fluorodeoxyglucose-positron emission tomography computed tomography scan showing increased fluorodeoxyglucose (FDG) uptake in the affected portion of the sigmoid colon (maximum standardized uptake value: 5.6 in the early phase and 7.4 in the late phase), but no increase in FDG uptake was observed in the surrounding lymph nodes or distant organs.
- Citation: Nishiyama N, Mori H, Kobara H, Rafiq K, Fujihara S, Kobayashi M, Masaki T. Difficulty in differentiating two cases of sigmoid stenosis by diverticulitis from cancer. World J Gastroenterol 2012; 18(27): 3623-3626
- URL: https://www.wjgnet.com/1007-9327/full/v18/i27/3623.htm
- DOI: https://dx.doi.org/10.3748/wjg.v18.i27.3623


