Copyright
©2012 Baishideng Publishing Group Co.
World J Gastroenterol. Jul 21, 2012; 18(27): 3617-3622
Published online Jul 21, 2012. doi: 10.3748/wjg.v18.i27.3617
Published online Jul 21, 2012. doi: 10.3748/wjg.v18.i27.3617
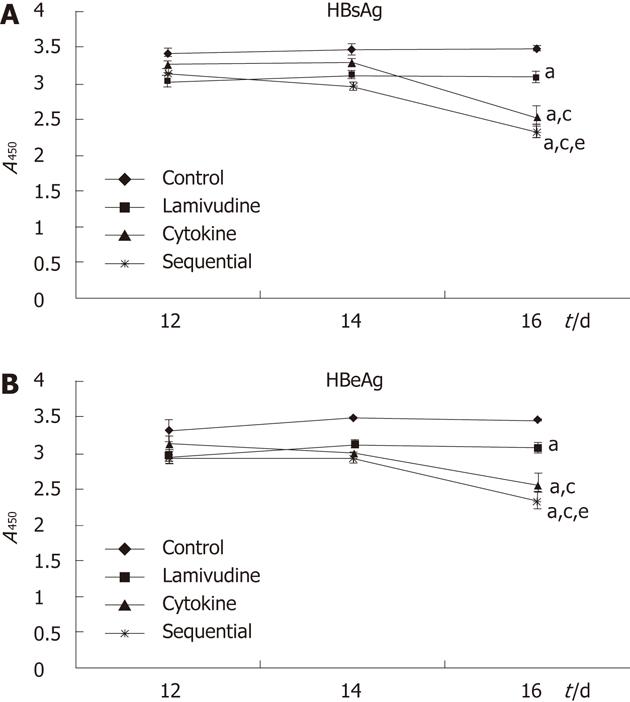
Figure 2 Levels of hepatitis B surface antigen and hepatitis B e antigen following different treatments of HepG2.
2.15 cells. Sequential treatment reduced the levels of hepatitis B surface antigen (HBsAg) (A) and hepatitis B e antigen (HBeAg) (B) most strongly at 16 d in the treatment period. aP < 0.05 vs control group, cP < 0.05 vs lamivudine group, eP < 0.05 vs cytokine group.
- Citation: Shi H, Lu L, Zhang NP, Zhang SC, Shen XZ. Effect of interferon-γ and tumor necrosis factor-α on hepatitis B virus following lamivudine treatment. World J Gastroenterol 2012; 18(27): 3617-3622
- URL: https://www.wjgnet.com/1007-9327/full/v18/i27/3617.htm
- DOI: https://dx.doi.org/10.3748/wjg.v18.i27.3617


