Copyright
©2012 Baishideng Publishing Group Co.
World J Gastroenterol. Jul 21, 2012; 18(27): 3537-3550
Published online Jul 21, 2012. doi: 10.3748/wjg.v18.i27.3537
Published online Jul 21, 2012. doi: 10.3748/wjg.v18.i27.3537
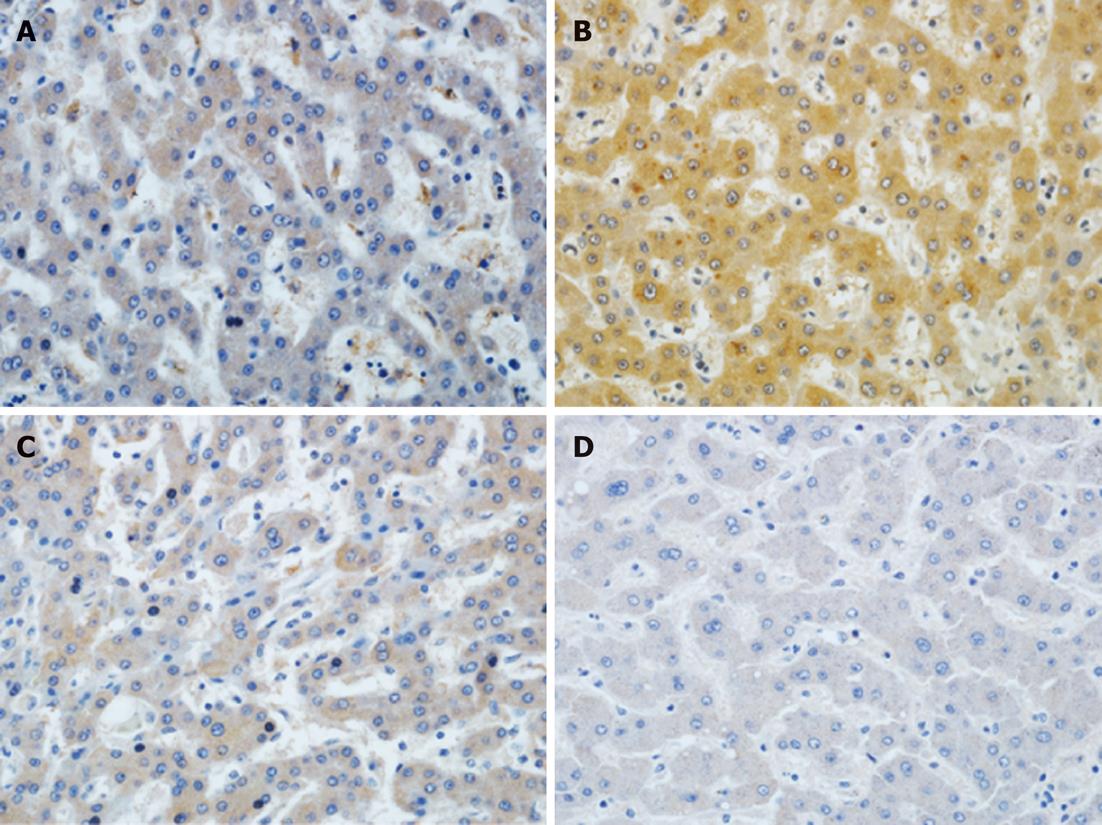
Figure 1 Immunohistochemical analysis of A20 expression in liver grafts on postoperative day 30.
Representative immunohistochemical sections from FK506 + physiological saline (A) treated livers demonstrate lower A20 expression compared to the substantial number of A20-positive liver cells in the FK506 + A20 treated liver grafts (B). Furthermore, the expression of FK506 + rAdEasy (C) is also low. D: The results of the normal control group (brown staining) (original magnification, 400 ×).
- Citation: Yang J, Xu MQ, Yan LN, Chen XB, Liu J. Zinc finger protein A20 protects rats against chronic liver allograft dysfunction. World J Gastroenterol 2012; 18(27): 3537-3550
- URL: https://www.wjgnet.com/1007-9327/full/v18/i27/3537.htm
- DOI: https://dx.doi.org/10.3748/wjg.v18.i27.3537


