Copyright
©2012 Baishideng Publishing Group Co.
World J Gastroenterol. Jul 21, 2012; 18(27): 3511-3519
Published online Jul 21, 2012. doi: 10.3748/wjg.v18.i27.3511
Published online Jul 21, 2012. doi: 10.3748/wjg.v18.i27.3511
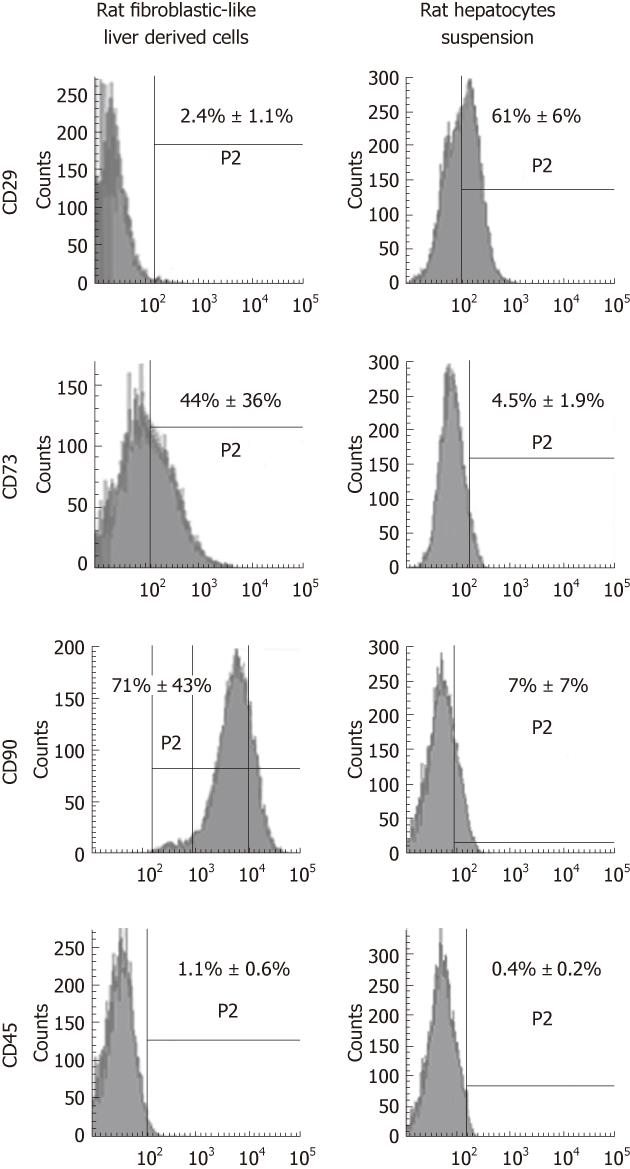
Figure 3 Representative surface markers expression analysis by flow cytometry.
Results are mean ± SE of positive cells for 5 independent experiments.
- Citation: Maerckx C, Scheers I, Tondreau T, Campard D, Nyabi O, Najimi M, Sokal E. Hepato-biliary profile of potential candidate liver progenitor cells from healthy rat liver. World J Gastroenterol 2012; 18(27): 3511-3519
- URL: https://www.wjgnet.com/1007-9327/full/v18/i27/3511.htm
- DOI: https://dx.doi.org/10.3748/wjg.v18.i27.3511


