Copyright
©2012 Baishideng Publishing Group Co.
World J Gastroenterol. Jul 14, 2012; 18(26): 3435-3442
Published online Jul 14, 2012. doi: 10.3748/wjg.v18.i26.3435
Published online Jul 14, 2012. doi: 10.3748/wjg.v18.i26.3435
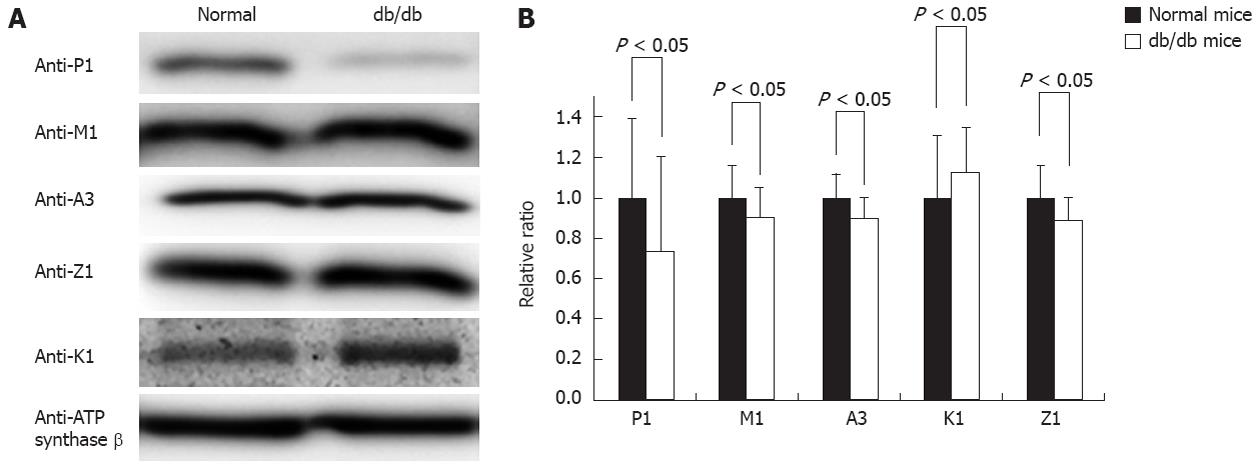
Figure 5 Comparison of mitochondrial glutathione S-transferase abundances between normal and diabetic mice by Western blotting.
A: A typical image of a Western blotting comparing a pair of mouse liver mitochondria from normal and diabetic mice. Approximately 20 μg mitochondrial proteins were loaded in each lane. Anti-ATP synthase β acted as a control to normalize the loading; B: The statistical comparison of the relative ratio of mitochondrial glutathione S-transferases (GSTs) between normal and diabetic mouse liver when normalized by the GSTs in normal mice (n = 3).
- Citation: Sun HD, Ru YW, Zhang DJ, Yin SY, Yin L, Xie YY, Guan YF, Liu SQ. Proteomic analysis of glutathione S-transferase isoforms in mouse liver mitochondria. World J Gastroenterol 2012; 18(26): 3435-3442
- URL: https://www.wjgnet.com/1007-9327/full/v18/i26/3435.htm
- DOI: https://dx.doi.org/10.3748/wjg.v18.i26.3435


