Copyright
©2012 Baishideng Publishing Group Co.
World J Gastroenterol. Jul 14, 2012; 18(26): 3435-3442
Published online Jul 14, 2012. doi: 10.3748/wjg.v18.i26.3435
Published online Jul 14, 2012. doi: 10.3748/wjg.v18.i26.3435
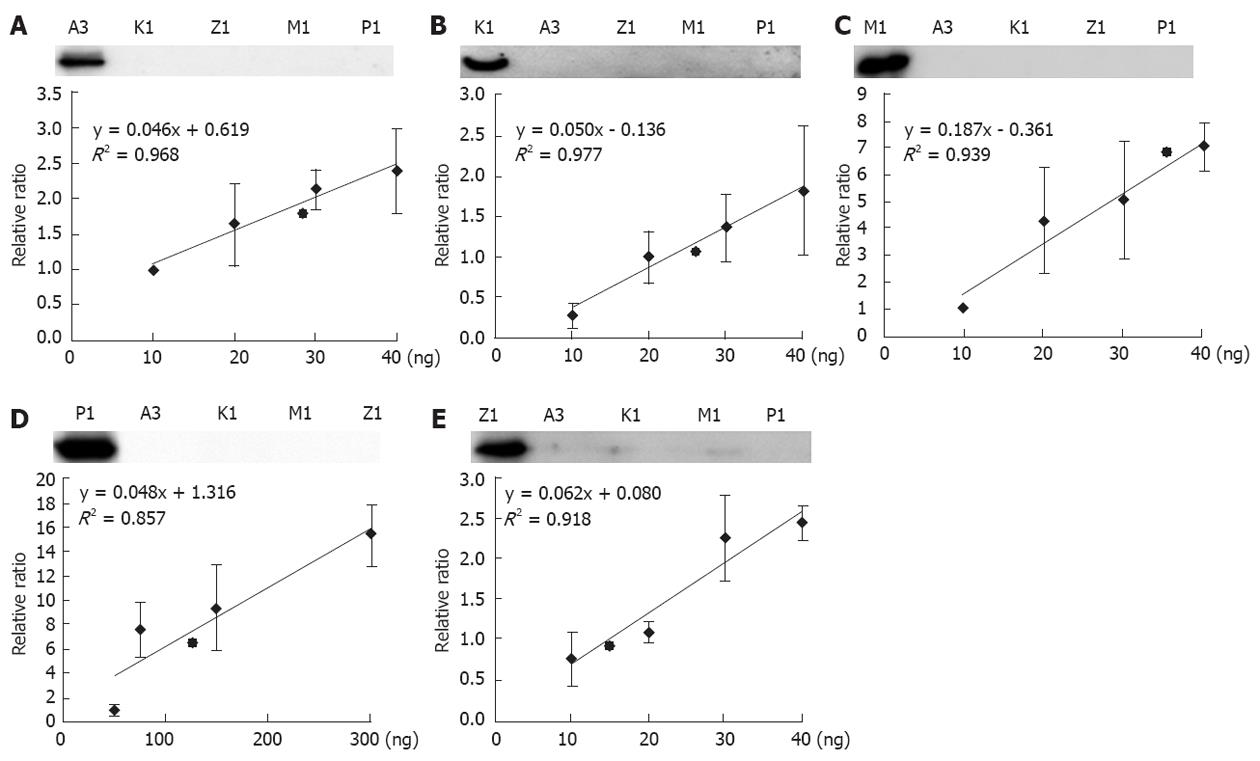
Figure 4 The calibration curves of mitochondrial glutathione S-transferase proteins.
Upper panel in A, B, C, D, E: Examination of the specificity of the five glutathione S-transferase (GST) antibodies, 2 ng of the corresponding GST was loaded in all of the left lanes, and 20 ng of the other unrelated GSTs was loaded in the other four lanes; Lower panel in A, B, C, D, E: The X-axis represents the amounts of recombinant GSTs loaded (ng), and the y-axis represents the relative intensity of the Western blotting, taking the signals generated from the lowest GST amount as the reference. The calibration curves were generated by regression. Insert: The linear equations and R2 were generated by regression.
- Citation: Sun HD, Ru YW, Zhang DJ, Yin SY, Yin L, Xie YY, Guan YF, Liu SQ. Proteomic analysis of glutathione S-transferase isoforms in mouse liver mitochondria. World J Gastroenterol 2012; 18(26): 3435-3442
- URL: https://www.wjgnet.com/1007-9327/full/v18/i26/3435.htm
- DOI: https://dx.doi.org/10.3748/wjg.v18.i26.3435


