Copyright
©2012 Baishideng Publishing Group Co.
World J Gastroenterol. Jun 28, 2012; 18(24): 3138-3144
Published online Jun 28, 2012. doi: 10.3748/wjg.v18.i24.3138
Published online Jun 28, 2012. doi: 10.3748/wjg.v18.i24.3138
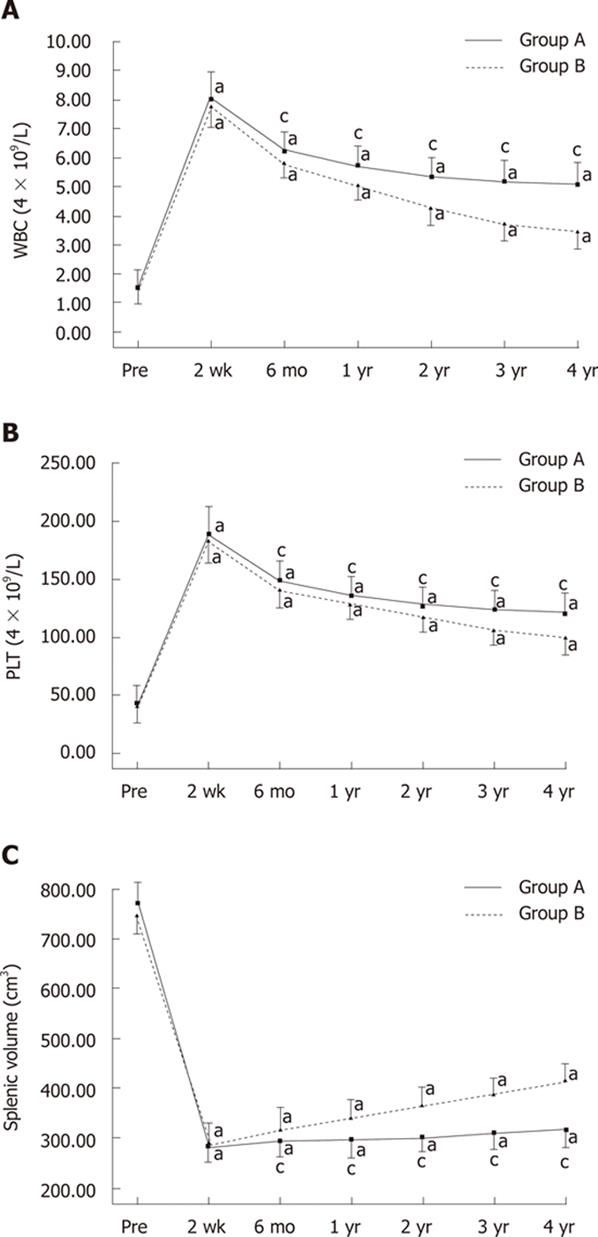
Figure 3 Curves of the white blood cell counts, platelet counts, and splenic volume in cirrhotic patients of group A (total splenic artery embolization) and group B (partial splenic embolization) before embolization and at the different follow-up time intervals.
A: Curves of long-term follow-up of white blood cell counts between the two groups; B: Curves of long-term follow-up of platelet counts between the two groups; C: Curves of long-term follow-up of splenic volume between the two groups. All values are expressed as mean ± SD. aP < 0.05 vs pre-embolization within each group; cP < 0. 05 group A vs group B at each time point determined with the Mann-Whitney test. WBC: White blood cell; PLT: Platelet.
- Citation: He XH, Gu JJ, Li WT, Peng WJ, Li GD, Wang SP, Xu LC, Ji J. Comparison of total splenic artery embolization and partial splenic embolization for hypersplenism. World J Gastroenterol 2012; 18(24): 3138-3144
- URL: https://www.wjgnet.com/1007-9327/full/v18/i24/3138.htm
- DOI: https://dx.doi.org/10.3748/wjg.v18.i24.3138


