Copyright
©2012 Baishideng Publishing Group Co.
World J Gastroenterol. Jun 21, 2012; 18(23): 2938-2947
Published online Jun 21, 2012. doi: 10.3748/wjg.v18.i23.2938
Published online Jun 21, 2012. doi: 10.3748/wjg.v18.i23.2938
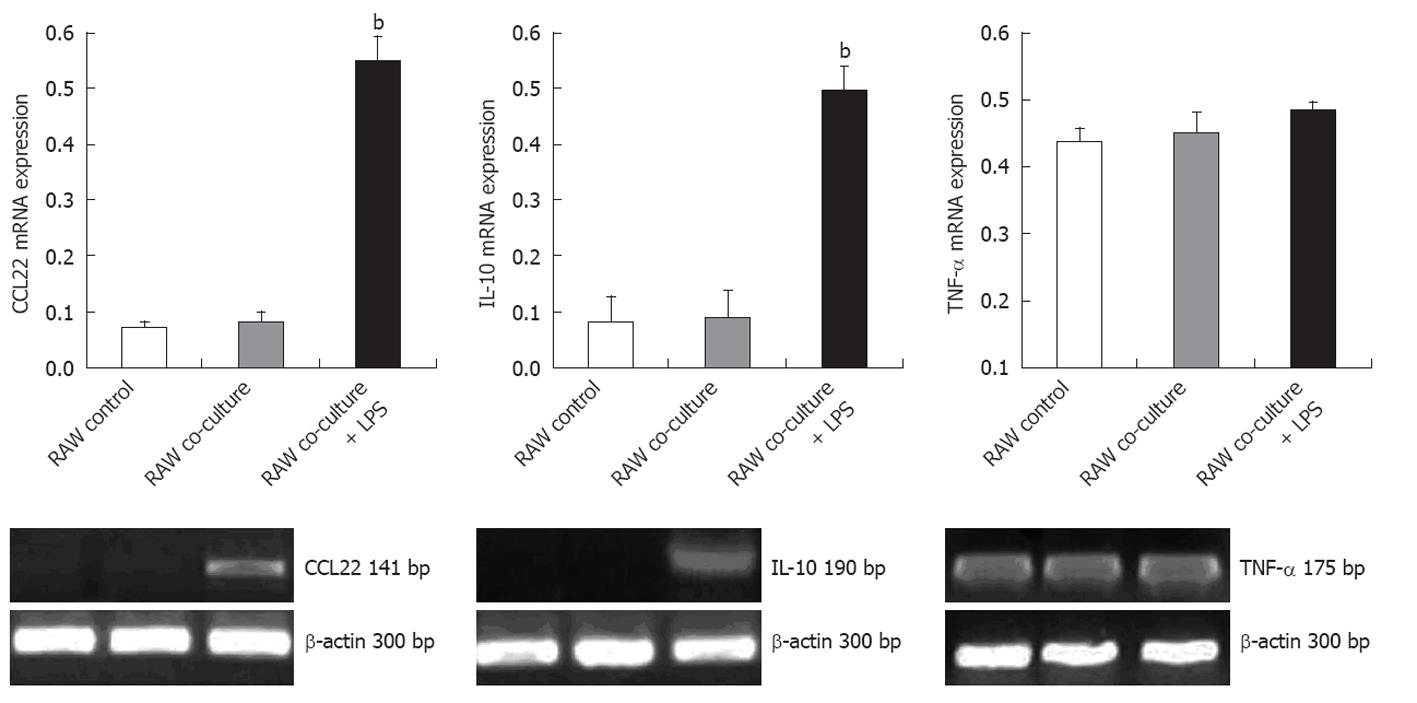
Figure 4 Tumor necrosis factor-α, interleukin-10, and CCL22 mRNA expression in RAW246.
7 and RAW246.7 cells co-cultured with H22 cells ± lipopolysaccharide. The bars indicate the relative amount of tumor necrosis factor (TNF)-α, interleukin (IL)-10 and CCL22 mRNA expression (reverse transcriptase polymerase chain reaction). LPS: Lipopolysaccharide. bP < 0.001 vs RAW co-culture.
-
Citation: Yang J, Zhang JX, Wang H, Wang GL, Hu QG, Zheng QC. Hepatocellular carcinoma and macrophage interaction induced tumor immunosuppression
via Treg requires TLR4 signaling. World J Gastroenterol 2012; 18(23): 2938-2947 - URL: https://www.wjgnet.com/1007-9327/full/v18/i23/2938.htm
- DOI: https://dx.doi.org/10.3748/wjg.v18.i23.2938


