Copyright
©2012 Baishideng Publishing Group Co.
World J Gastroenterol. Jun 14, 2012; 18(22): 2784-2792
Published online Jun 14, 2012. doi: 10.3748/wjg.v18.i22.2784
Published online Jun 14, 2012. doi: 10.3748/wjg.v18.i22.2784
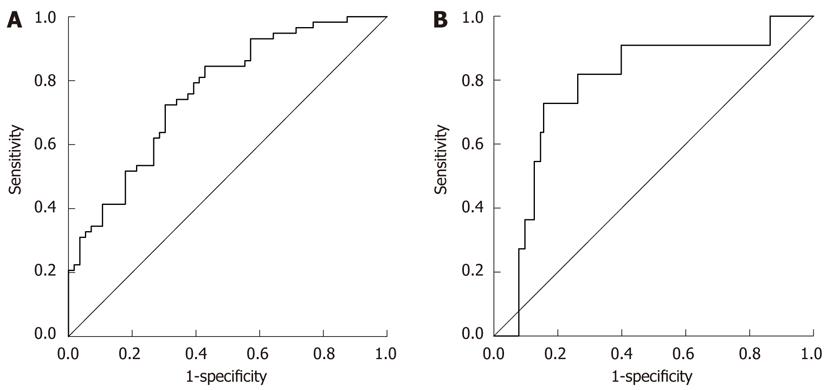
Figure 3 Receiver operating characteristic curves generated by globulin/platelet model for prediction of F0-F1 (A) and F4 (B).
The area under the curve of GP model for the discrimination between minimal fibrosis (F0-F1) and significant fibrosis (F2, F3, F4), and between non-cirrhosis (F0, F1, F2, F3) and cirrhosis (F4) was 0.732 [confidence interval (CI): 0.642-0.823] and 0.738 (CI: 0.612-0.864). Using a cutoff value of < 1.68, GP model had a sensitivity of 72.4%, a positive predictive value (PPV) of 71.2%, a specificity of 69.6%, and a negative predictive value (NPV) of 70.8% for the prediction of F0-F1. For the prediction of cirrhosis (F4) at a cutoff value of > 2.53, GP model had a sensitivity of 72.7%, a PPV of 33.4%, a specificity of 84.5%, and a NPV of 96.7%.
- Citation: Liu XD, Wu JL, Liang J, Zhang T, Sheng QS. Globulin-platelet model predicts minimal fibrosis and cirrhosis in chronic hepatitis B virus infected patients. World J Gastroenterol 2012; 18(22): 2784-2792
- URL: https://www.wjgnet.com/1007-9327/full/v18/i22/2784.htm
- DOI: https://dx.doi.org/10.3748/wjg.v18.i22.2784


