Copyright
©2012 Baishideng Publishing Group Co.
World J Gastroenterol. Jun 14, 2012; 18(22): 2784-2792
Published online Jun 14, 2012. doi: 10.3748/wjg.v18.i22.2784
Published online Jun 14, 2012. doi: 10.3748/wjg.v18.i22.2784
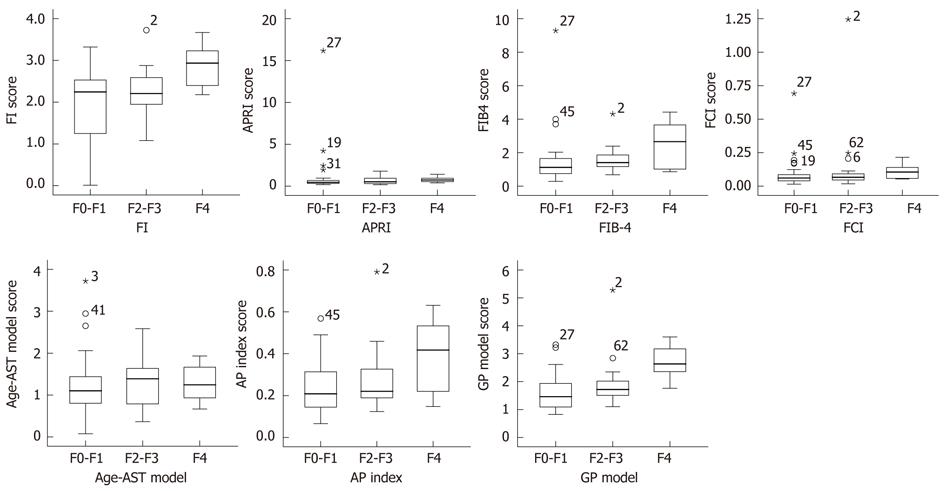
Figure 2 Box plot of fibrosis index, aspartate aminotransferase-platelet ratio, FIB-4, fibrosis-cirrhosis index, age-aspartate aminotransferase model, age-platelet count ratio and globulin/platelet model in relation to F0-F1, F2-F3 and F4 fibrosis stage.
The box represents the interquartile range. The whiskers indicate the highest and lowest values, and the asterisks represent outliers. The line across the box indicates the median value. FI: Fibrosis index; GP: Globulin/platelet; FCI: Fibrosis-cirrhosis index; AST: Aspartate aminotransferase; APRI: AST-platelet ratio; AP index: Age-platelet count ratio.
- Citation: Liu XD, Wu JL, Liang J, Zhang T, Sheng QS. Globulin-platelet model predicts minimal fibrosis and cirrhosis in chronic hepatitis B virus infected patients. World J Gastroenterol 2012; 18(22): 2784-2792
- URL: https://www.wjgnet.com/1007-9327/full/v18/i22/2784.htm
- DOI: https://dx.doi.org/10.3748/wjg.v18.i22.2784


