Copyright
©2012 Baishideng Publishing Group Co.
World J Gastroenterol. May 28, 2012; 18(20): 2533-2539
Published online May 28, 2012. doi: 10.3748/wjg.v18.i20.2533
Published online May 28, 2012. doi: 10.3748/wjg.v18.i20.2533
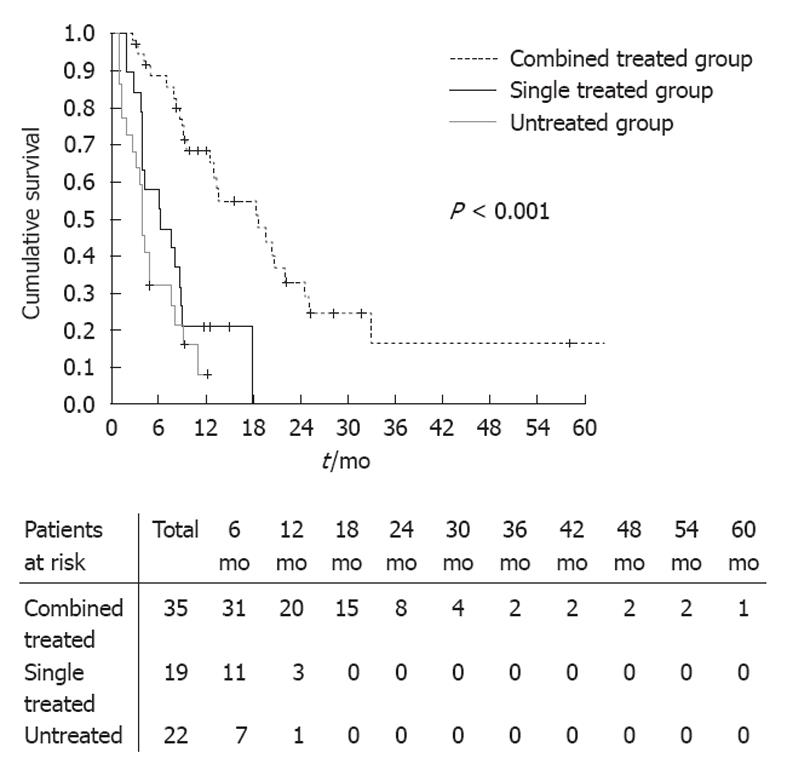
Figure 2 Comparison of survival among three treatment groups.
Survival curves of untreated group (n = 22), single treatment group (n = 19), and combined treatment group (n = 35).
- Citation: Yang T, Lu JH, Lin C, Shi S, Chen TH, Zhao RH, Wang Y, Wu MC. Concomitant lung metastasis in patients with advanced hepatocellular carcinoma. World J Gastroenterol 2012; 18(20): 2533-2539
- URL: https://www.wjgnet.com/1007-9327/full/v18/i20/2533.htm
- DOI: https://dx.doi.org/10.3748/wjg.v18.i20.2533


