Copyright
©2012 Baishideng Publishing Group Co.
World J Gastroenterol. May 28, 2012; 18(20): 2481-2492
Published online May 28, 2012. doi: 10.3748/wjg.v18.i20.2481
Published online May 28, 2012. doi: 10.3748/wjg.v18.i20.2481
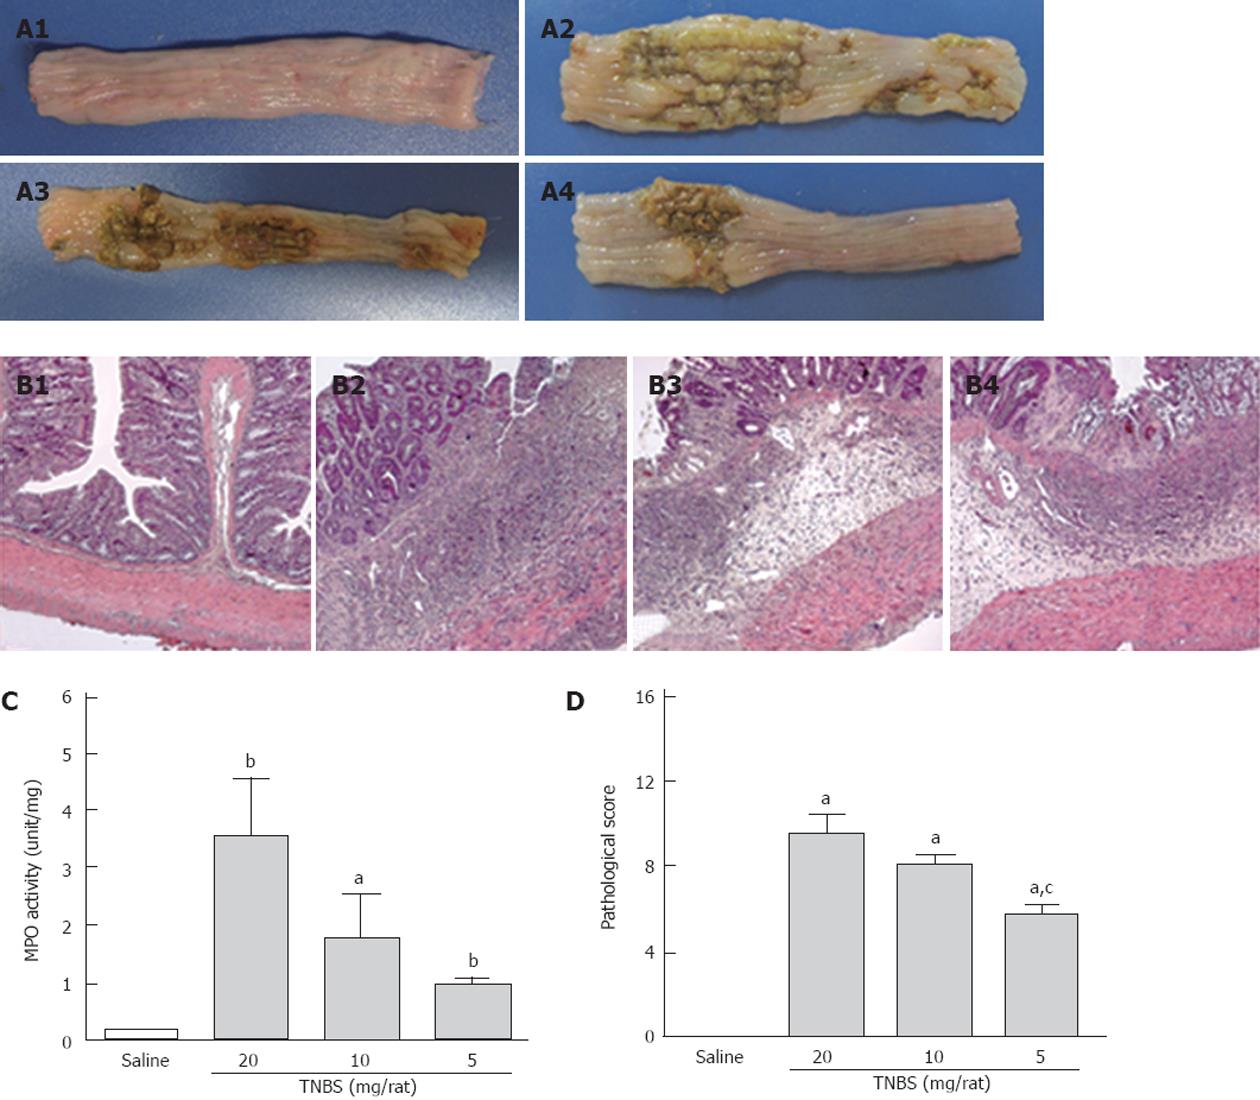
Figure 1 Acute colonic inflammation and damage induced by different doses of trinitrobenzene sulfonic acid at 5 d after trinitrobenzene sulfonic acid administration.
Panel A depicts the appearance of colon tissue in saline (A1), high dose trinitrobenzene sulfonic acid (TNBS) (20 mg/rat, A2), medium dose TNBS (10 mg/rat, A3), and low dose TNBS (5 mg/rat, A4)-treated groups; Panel B depicts the representative histological changes of colon tissue in saline (B1), high dose TNBS (B2), median dose TNBS (B3), and low dose TNBS (B4)-treated groups (hematoxylin and eosin staining, 100×); Statistical analysis of myeloperoxidase (MPO) activity is shown in panel (C), and pathological score in panel (D). Data are shown as mean ± SE, n = 4 per group. aP < 0.05, bP < 0.01 vs saline-treated group; cP < 0.05 vs high dose TNBS-treated group (one-way analysis of variance, Student-Newman-Keuls).
- Citation: Qin HY, Xiao HT, Wu JC, Berman BM, Sung JJ, Bian ZX. Key factors in developing the trinitrobenzene sulfonic acid-induced post-inflammatory irritable bowel syndrome model in rats. World J Gastroenterol 2012; 18(20): 2481-2492
- URL: https://www.wjgnet.com/1007-9327/full/v18/i20/2481.htm
- DOI: https://dx.doi.org/10.3748/wjg.v18.i20.2481


