Copyright
©2012 Baishideng Publishing Group Co.
World J Gastroenterol. May 28, 2012; 18(20): 2472-2480
Published online May 28, 2012. doi: 10.3748/wjg.v18.i20.2472
Published online May 28, 2012. doi: 10.3748/wjg.v18.i20.2472
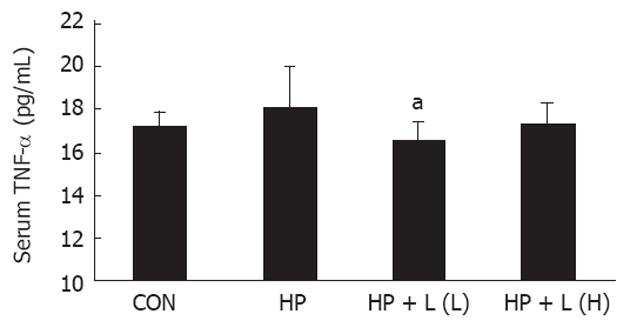
Figure 2 A bar graph shows the mean ± SD of serum tumor necrosis factor-alpha level (pg/mL) in all groups.
CON: Control group; HP: Helicobacter pylori (H. pylori) infected group; HP + L (L): Lactobacillus plantarum (L. plantarum) B7 106 CFUs/mL treated group; HP + L (H): L. plantarum B7 1010 CFUs/mL treated group. Each group is represented by the mean of 8 rats. aP < 0.05 vs H. pylori infected group. TNF-α: Tumor necrosis factor-alpha.
-
Citation: Sunanliganon C, Thong-Ngam D, Tumwasorn S, Klaikeaw N.
Lactobacillus plantarum B7 inhibitsHelicobacter pylori growth and attenuates gastric inflammation. World J Gastroenterol 2012; 18(20): 2472-2480 - URL: https://www.wjgnet.com/1007-9327/full/v18/i20/2472.htm
- DOI: https://dx.doi.org/10.3748/wjg.v18.i20.2472


