Copyright
©2012 Baishideng Publishing Group Co.
World J Gastroenterol. May 28, 2012; 18(20): 2472-2480
Published online May 28, 2012. doi: 10.3748/wjg.v18.i20.2472
Published online May 28, 2012. doi: 10.3748/wjg.v18.i20.2472
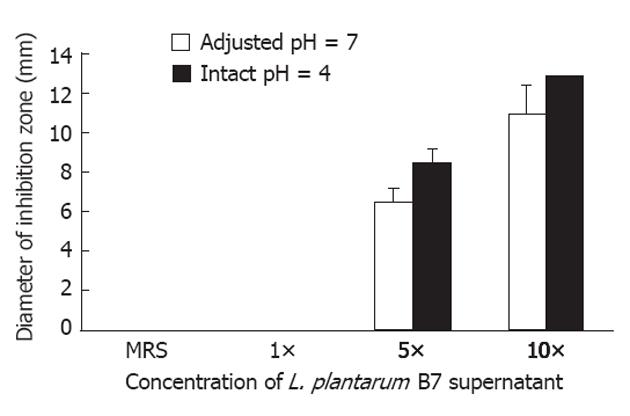
Figure 1 A bar graph shows the mean ± SD of inhibitory zone diameters (mm) of all Lactobacillus plantarum B7 supernatant concentrations at intact pH 4 and adjusted pH 7 (n = 2).
L. plantarum: Lactobacillus plantarum; MRS: Man-Rogosa-Sharpe.
-
Citation: Sunanliganon C, Thong-Ngam D, Tumwasorn S, Klaikeaw N.
Lactobacillus plantarum B7 inhibitsHelicobacter pylori growth and attenuates gastric inflammation. World J Gastroenterol 2012; 18(20): 2472-2480 - URL: https://www.wjgnet.com/1007-9327/full/v18/i20/2472.htm
- DOI: https://dx.doi.org/10.3748/wjg.v18.i20.2472


