Copyright
©2012 Baishideng Publishing Group Co.
World J Gastroenterol. Jan 14, 2012; 18(2): 175-181
Published online Jan 14, 2012. doi: 10.3748/wjg.v18.i2.175
Published online Jan 14, 2012. doi: 10.3748/wjg.v18.i2.175
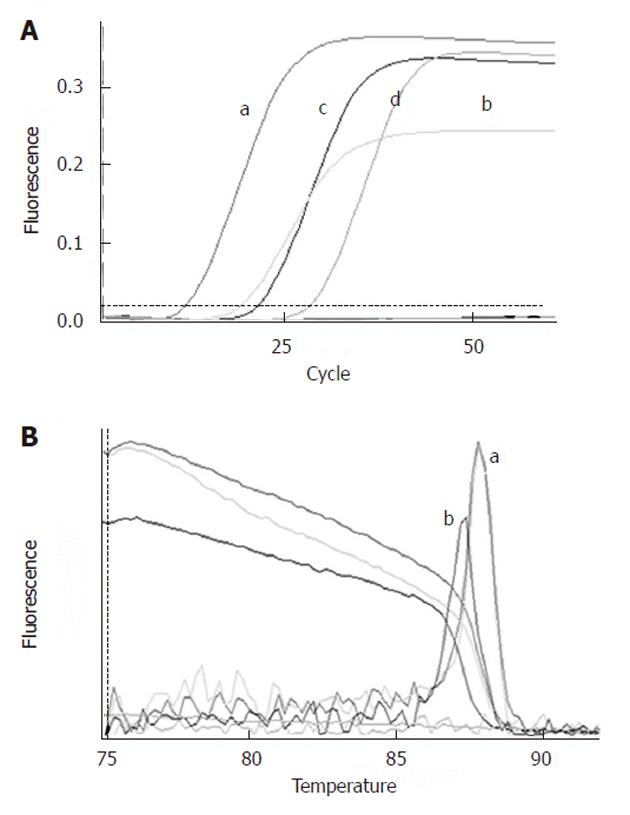
Figure 1 Gene expression levels of cytokeratin 19 and human telomerase reverse transcriptase in RMCCA1 cells (as measured by quantitative real time polymerase chain reaction).
A: Amplification plot of cytokeratin (CK)19 mRNA from 10 000 RMCCA1 cells. (a) 1000 RMCCA1 cells; (b) amplification plot of human telomerase reverse transcriptase (hTERT) mRNA from 10 000 RMCCA1 cells; (c) 1000 RMCCA1 cells; and (d) are demonstrated; B: SYBR Green melting curve for quantitative real time reverse transcription polymerase chain reaction (RT-PCR). The melting curves from quantitative real time PCR for CK19 (a) and hTERT (b) consistently gave a single peak with no evidence of non-specific amplification or primer-dimerisation.
- Citation: Leelawat K, Narong S, Udomchaiprasertkul W, Wannaprasert J, Treepongkaruna SA, Subwongcharoen S, Ratanashu-ek T. Prognostic relevance of circulating CK19 mRNA in advanced malignant biliary tract diseases. World J Gastroenterol 2012; 18(2): 175-181
- URL: https://www.wjgnet.com/1007-9327/full/v18/i2/175.htm
- DOI: https://dx.doi.org/10.3748/wjg.v18.i2.175


