Copyright
©2012 Baishideng Publishing Group Co.
World J Gastroenterol. May 21, 2012; 18(19): 2320-2333
Published online May 21, 2012. doi: 10.3748/wjg.v18.i19.2320
Published online May 21, 2012. doi: 10.3748/wjg.v18.i19.2320
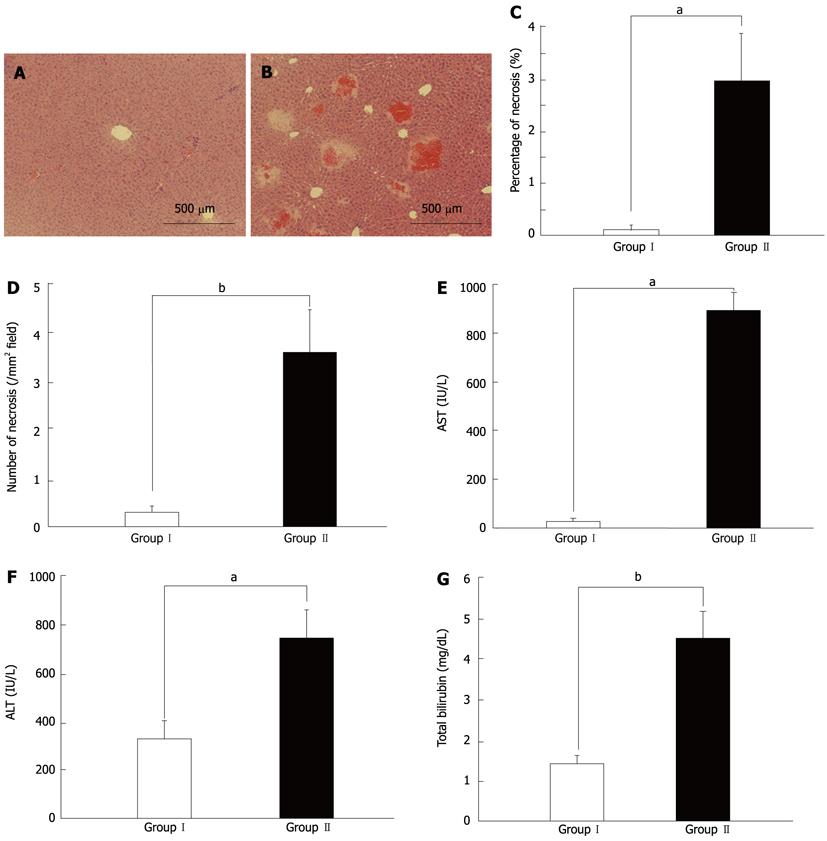
Figure 1 Histological and hematological differences between groups I and II at 6 h after 80%-partial hepatectomy.
A: Histological findings in group I mice; B: Representative images of remnant liver histology demonstrating significant multiple foci of hemorrhage and necrosis in group II mice; C: Quantitation of the size (area percentage) of hemorrhage and necrosis: Significantly larger areas and more hemorrhagic and necrotic foci were observed in group II mice than in group I mice (aP < 0.05); D: Quantitation of the number of foci of hemorrhage and necrosis per mm2: Significantly larger areas and more hemorrhagic and necrotic foci were observed in group II mice than in group I mice (bP < 0.01); E: Aspartate aminotransferase (AST) levels were significantly higher in group II mice than those in group I mice (aP < 0.05); F: Alanine aminotransaminase (ALT) levels were significantly higher in group II mice than those in group I mice (aP < 0.05); G: Total bilirubin levels were significantly higher in group II mice than those in group I mice (bP < 0.01).
- Citation: Ohashi N, Hori T, Chen F, Jermanus S, Eckman CB, Nakao A, Uemoto S, Nguyen JH. Matrix metalloproteinase-9 contributes to parenchymal hemorrhage and necrosis in the remnant liver after extended hepatectomy in mice. World J Gastroenterol 2012; 18(19): 2320-2333
- URL: https://www.wjgnet.com/1007-9327/full/v18/i19/2320.htm
- DOI: https://dx.doi.org/10.3748/wjg.v18.i19.2320


