Copyright
©2012 Baishideng Publishing Group Co.
World J Gastroenterol. May 7, 2012; 18(17): 2084-2091
Published online May 7, 2012. doi: 10.3748/wjg.v18.i17.2084
Published online May 7, 2012. doi: 10.3748/wjg.v18.i17.2084
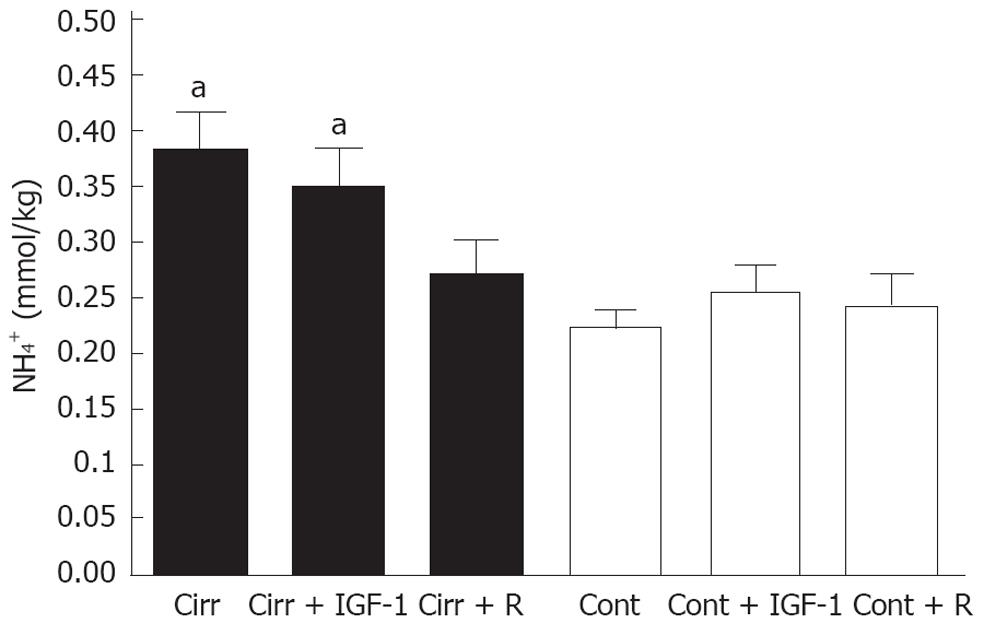
Figure 2 Brain ammonia levels.
Comparison of the concentrations of brain ammonia in cirrhotic groups (closed bars) and control groups (open bars). Liver cirrhosis plus portal vein occlusion resulted in an increase in brain ammonia levels compared to controls, whereas in rifaximin-treated cirrhotic rats, these levels remained similar to those in controls. insulin-like growth factor (IGF)-1 did not significantly decrease these values compared to the respective controls. aP < 0.05 vs each control group. Cirr: Cirrhosis; Cont: Control; R: Rifaximin.
- Citation: Òdena G, Miquel M, Serafín A, Galan A, Morillas R, Planas R, Bartolí R. Rifaximin, but not growth factor 1, reduces brain edema in cirrhotic rats. World J Gastroenterol 2012; 18(17): 2084-2091
- URL: https://www.wjgnet.com/1007-9327/full/v18/i17/2084.htm
- DOI: https://dx.doi.org/10.3748/wjg.v18.i17.2084


