Copyright
©2012 Baishideng Publishing Group Co.
World J Gastroenterol. May 7, 2012; 18(17): 2043-2052
Published online May 7, 2012. doi: 10.3748/wjg.v18.i17.2043
Published online May 7, 2012. doi: 10.3748/wjg.v18.i17.2043
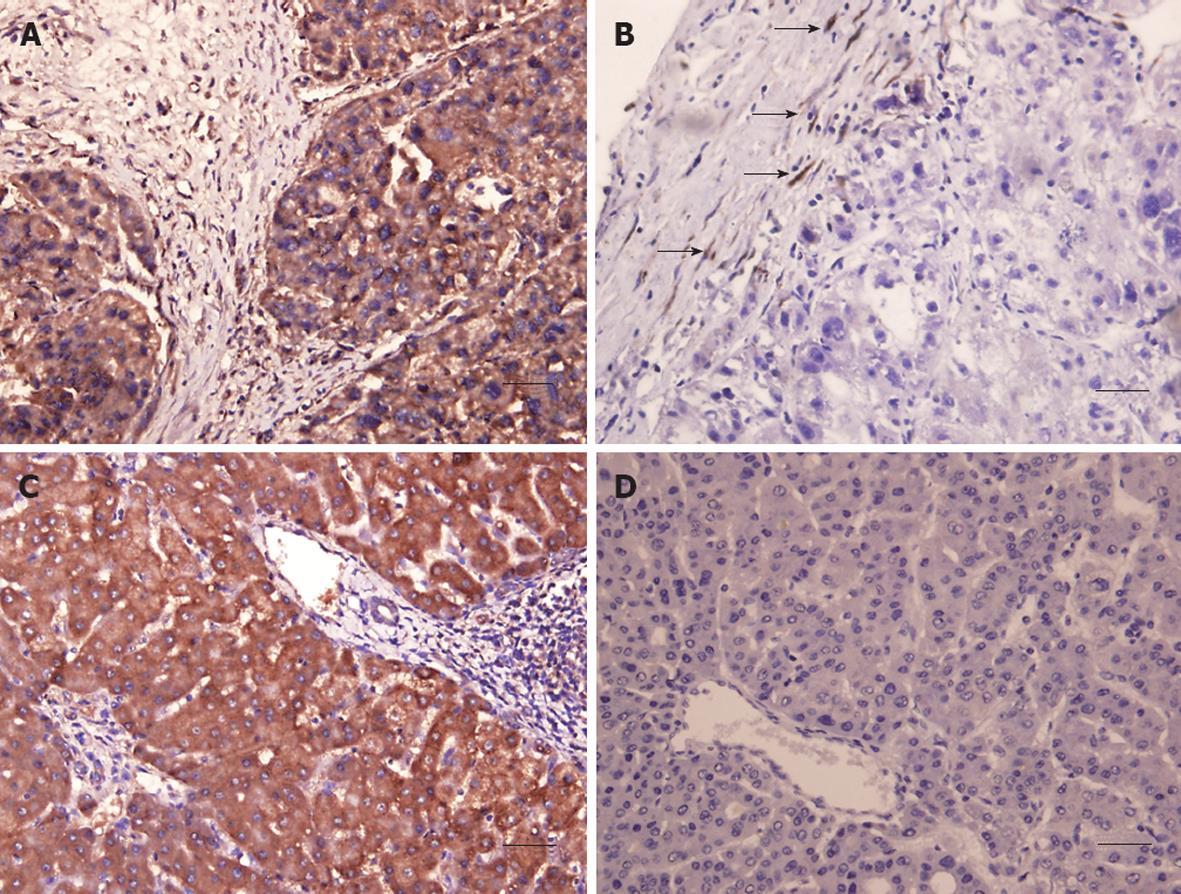
Figure 5 Immunohistochemical analysis of secreted protein acidic and rich in cysteine expression.
A: A tumor with positive staining; B: A tumor with negative result, but stromal tissues with positive signal (arrows); C: Nontumorous tissues with positive staining; D: Nontumorous tissues with negative staining; Scale bar: 50 μm.
-
Citation: Zhang Y, Yang B, Du Z, Bai T, Gao YT, Wang YJ, Lou C, Wang FM, Bai Y. Aberrant methylation of
SPARC in human hepatocellular carcinoma and its clinical implication. World J Gastroenterol 2012; 18(17): 2043-2052 - URL: https://www.wjgnet.com/1007-9327/full/v18/i17/2043.htm
- DOI: https://dx.doi.org/10.3748/wjg.v18.i17.2043


