Copyright
©2012 Baishideng Publishing Group Co.
World J Gastroenterol. Apr 21, 2012; 18(15): 1753-1764
Published online Apr 21, 2012. doi: 10.3748/wjg.v18.i15.1753
Published online Apr 21, 2012. doi: 10.3748/wjg.v18.i15.1753
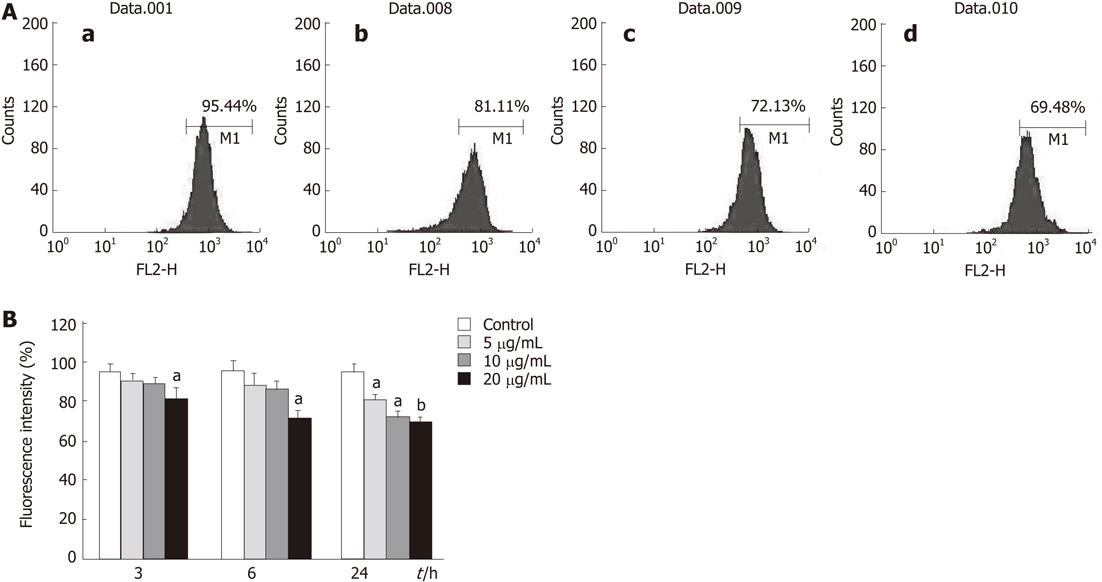
Figure 8 Effects of tectorigenin on integrity of mitochondrial membrane in HepG2 cells.
Cells were treated with tectorigenin for different time points, then incubated with Rhodamine 123 and analyzed by flow cytometry. A: HepG2 cells were treated with 0 (a), 5 (b), 10 (c) and 20 (d) mg/L tectorigenin for 24 h. Mitochondrial membrane potential was measured by Rh123, a fluorescent probe, on FACSCalibur at FL2 channel with an excitation wavelength of 488 nm. Each test was performed 3 times and images presented were typical of 3 independent experiments; B: The data were presented as mean ± SD (n = 3). Difference was considered statistically significant when aP < 0.05 and bP < 0.01 vs control.
- Citation: Jiang CP, Ding H, Shi DH, Wang YR, Li EG, Wu JH. Pro-apoptotic effects of tectorigenin on human hepatocellular carcinoma HepG2 cells. World J Gastroenterol 2012; 18(15): 1753-1764
- URL: https://www.wjgnet.com/1007-9327/full/v18/i15/1753.htm
- DOI: https://dx.doi.org/10.3748/wjg.v18.i15.1753


