Copyright
©2012 Baishideng Publishing Group Co.
World J Gastroenterol. Apr 7, 2012; 18(13): 1485-1495
Published online Apr 7, 2012. doi: 10.3748/wjg.v18.i13.1485
Published online Apr 7, 2012. doi: 10.3748/wjg.v18.i13.1485
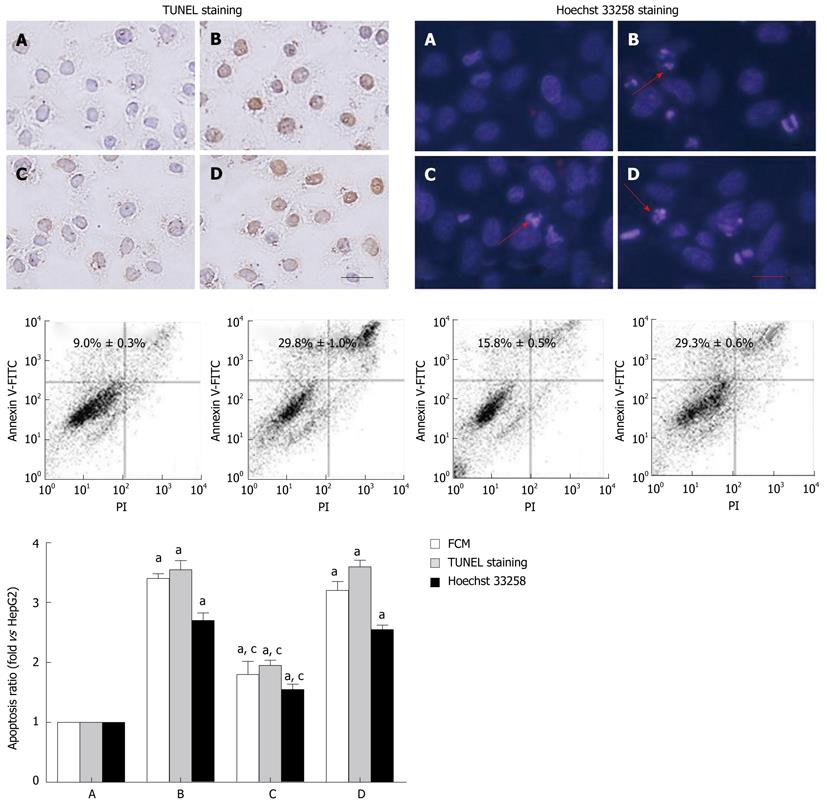
Figure 2 Apoptosis of HepG2 cells induced by hepatitis B virus X protein.
HepG2 cells were cotransfected with pcDNA3.1-X and pSilencer3.1-shHBX as RNAi group, and HepG2 cells were cotransfected with pcDNA3.1-X and pSilencer3.1-H1 plasmids as negative control. Cells were examined by TUNEL, Hoechst 33258 staining and flow cytometry as described in Materials and Methods. A: HepG2 group; B: pcDNA3.1-X transfected group; C: RNAi group; D: Negative control group. Data was expressed as mean ± SD (n = 3), aP < 0.05 vs the HepG2 group; cP < 0.05 vs pcDNA3.1-X transfected group and negative control group. Scale bar value: 5 μm. Red arrows indicate apoptotic nuclei. Apoptosis ratio= (apoptotic cells/total cells) × 100%. TUNEL: Terminal deoxynucleotidyl transferase-mediated dUTP-biotin nick end labeling.
- Citation: Tang RX, Kong FY, Fan BF, Liu XM, You HJ, Zhang P, Zheng KY. HBx activates FasL and mediates HepG2 cell apoptosis through MLK3-MKK7-JNKs signal module. World J Gastroenterol 2012; 18(13): 1485-1495
- URL: https://www.wjgnet.com/1007-9327/full/v18/i13/1485.htm
- DOI: https://dx.doi.org/10.3748/wjg.v18.i13.1485


