Copyright
©2012 Baishideng Publishing Group Co.
World J Gastroenterol. Apr 7, 2012; 18(13): 1459-1469
Published online Apr 7, 2012. doi: 10.3748/wjg.v18.i13.1459
Published online Apr 7, 2012. doi: 10.3748/wjg.v18.i13.1459
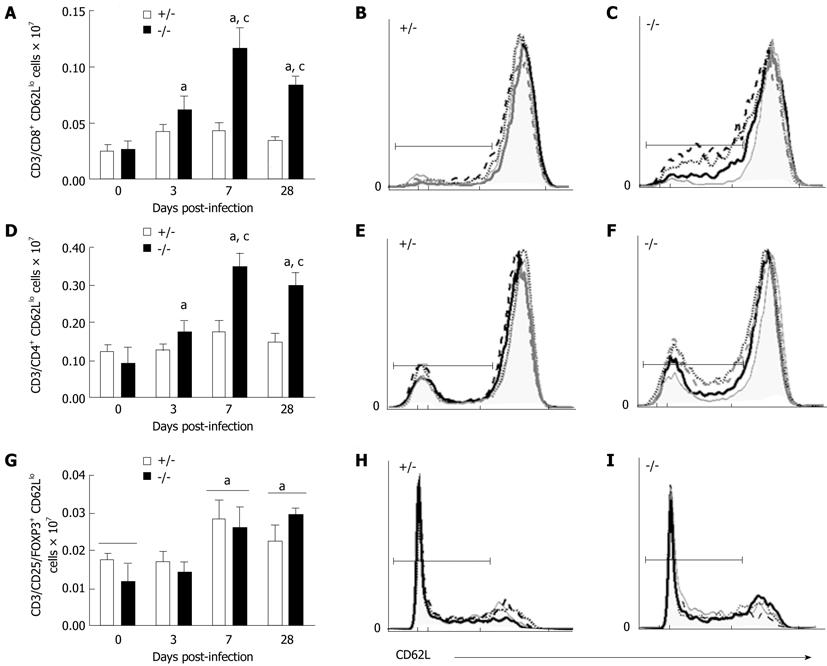
Figure 4 Changes in effector T lymphocyte populations in the mesenteric lymph nodes of drosophila mothers against decapentaplegic 3+/- and drosophila mothers against decapentaplegic-/- mice following infection with Helicobacter hepaticus.
Flow cytometric analysis of lymphocyte populations at days 0, 3, 7 and 28 post-infection. Gates were drawn on viable cells using forward scatter vs side scatter parameters. Histograms represent CD62L expression at 0 d (solid grey), 3 d (dotted black), 7 d (dashed black) and 28 d (solid black) post-infection. Y-axis represents relative cell frequency. X-axis is CD62L expression. Brackets indicate CD62Llo gate used to determine cell percentages. A: Total CD8+ CD62Llo lymphocytes gated on CD3+/CD8+ lymphocytes; B: CD62L expression in drosophila mothers against decapentaplegic (SMAD)3+/- CD8+ lymphocytes; C: CD62L expression in SMAD3-/- CD8+ lymphocytes; D: Total CD4+ CD62Llo lymphocytes gated on CD3+/CD4+ lymphocytes; E: CD62L expression in SMAD3+/- CD4+ lymphocytes; F: CD62L expression in SMAD3-/- CD4+ lymphocytes; G: Total CD25+/FOXP3+ CD62Llo Treg cells gated on CD3+/CD4+ lymphocytes (n = 4-6 animals per time point); H: CD62L expression in SMAD3+/- CD25+/FOXP3+ lymphocytes; I: CD62L expression in SMAD3-/- CD25+/FOXP3+ lymphocytes. aP < 0.05 vs baseline values; cP < 0.01 denotes significant interaction between genotypes (SMAD3-/-vs SMAD3+/–).
-
Citation: McCaskey SJ, Rondini EA, Clinthorne JF, Langohr IM, Gardner EM, Fenton JI. Increased presence of effector lymphocytes during
Helicobacter hepaticus -induced colitis. World J Gastroenterol 2012; 18(13): 1459-1469 - URL: https://www.wjgnet.com/1007-9327/full/v18/i13/1459.htm
- DOI: https://dx.doi.org/10.3748/wjg.v18.i13.1459


