Copyright
©2012 Baishideng Publishing Group Co.
World J Gastroenterol. Mar 28, 2012; 18(12): 1328-1338
Published online Mar 28, 2012. doi: 10.3748/wjg.v18.i12.1328
Published online Mar 28, 2012. doi: 10.3748/wjg.v18.i12.1328
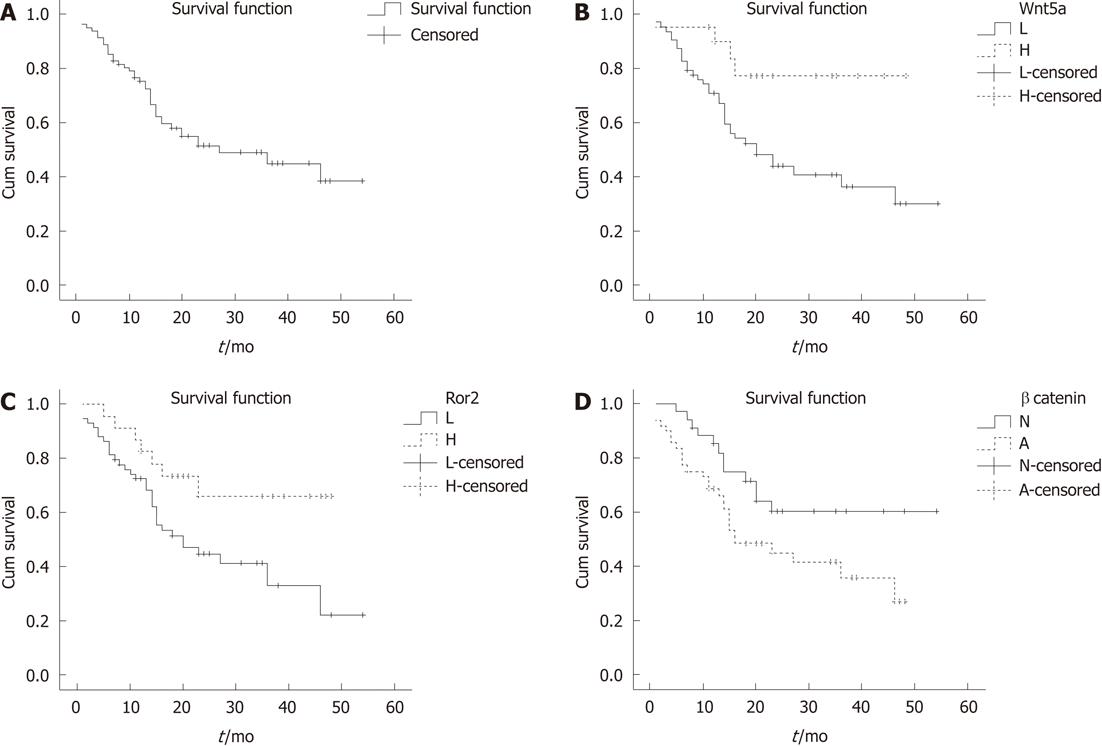
Figure 5 Survival curves of 82 hepatocellular carcinoma patients.
A: Overall survival curves of 82 hepatocellular carcinoma (HCC) patients; B: Survival curves of 82 HCC patients with tumors expressing low or high levels of Wnt member 5a (Wnt5a) (log-rank test, P = 0.016); C: Survival curves of 82 HCC patients with tumors expressing low or high levels of receptor 2 (Ror2) (log-rank test, P = 0.007); D: Survival curves of 82 HCC patients with tumors expressing low or high levels of β-catenin (log-rank test, P = 0.045). L: Low expression; H: High expression; N: Normal expression; A: Abnormal expression.
- Citation: Geng M, Cao YC, Chen YJ, Jiang H, Bi LQ, Liu XH. Loss of Wnt5a and Ror2 protein in hepatocellular carcinoma associated with poor prognosis. World J Gastroenterol 2012; 18(12): 1328-1338
- URL: https://www.wjgnet.com/1007-9327/full/v18/i12/1328.htm
- DOI: https://dx.doi.org/10.3748/wjg.v18.i12.1328


