Copyright
©2012 Baishideng Publishing Group Co.
World J Gastroenterol. Mar 14, 2012; 18(10): 1130-1136
Published online Mar 14, 2012. doi: 10.3748/wjg.v18.i10.1130
Published online Mar 14, 2012. doi: 10.3748/wjg.v18.i10.1130
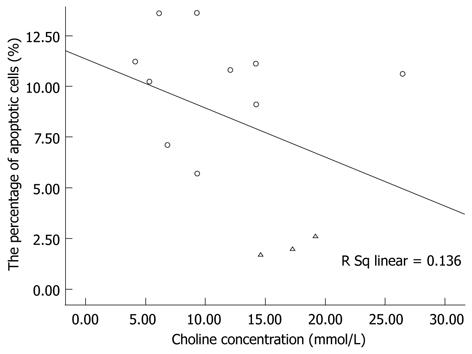
Figure 5 Scatter diagram shows the correlation between the percentage of apoptotic cells and choline concentration in the control group (Δ) and the experiment group after injection of sodium selenite (ο).
The linear regression analysis revealed no significant linear relationship between variables (R = 0.369, F = 1.734, P > 0.05).
- Citation: Shen ZW, Cao Z, You KZ, Yang ZX, Xiao YY, Cheng XF, Chen YW, Wu RH. Quantification of choline concentration following liver cell apoptosis using 1H magnetic resonance spectroscopy. World J Gastroenterol 2012; 18(10): 1130-1136
- URL: https://www.wjgnet.com/1007-9327/full/v18/i10/1130.htm
- DOI: https://dx.doi.org/10.3748/wjg.v18.i10.1130


