Copyright
©2012 Baishideng Publishing Group Co.
World J Gastroenterol. Mar 14, 2012; 18(10): 1130-1136
Published online Mar 14, 2012. doi: 10.3748/wjg.v18.i10.1130
Published online Mar 14, 2012. doi: 10.3748/wjg.v18.i10.1130
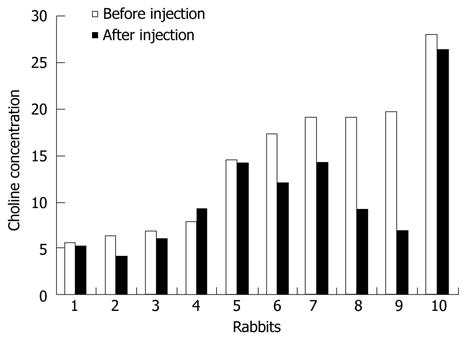
Figure 3 Barplot shows the choline concentration of livers from 10 rabbits before and after injection of sodium selenite.
The two-sample Wilcoxon test revealed significant differences between the groups (Z = -2.395, P < 0.05).
- Citation: Shen ZW, Cao Z, You KZ, Yang ZX, Xiao YY, Cheng XF, Chen YW, Wu RH. Quantification of choline concentration following liver cell apoptosis using 1H magnetic resonance spectroscopy. World J Gastroenterol 2012; 18(10): 1130-1136
- URL: https://www.wjgnet.com/1007-9327/full/v18/i10/1130.htm
- DOI: https://dx.doi.org/10.3748/wjg.v18.i10.1130


