Copyright
©2012 Baishideng Publishing Group Co.
World J Gastroenterol. Mar 14, 2012; 18(10): 1077-1084
Published online Mar 14, 2012. doi: 10.3748/wjg.v18.i10.1077
Published online Mar 14, 2012. doi: 10.3748/wjg.v18.i10.1077
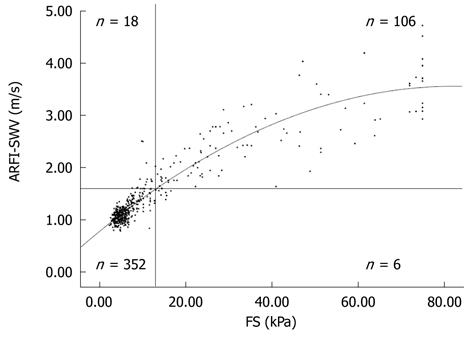
Figure 1 Correlation of acoustic radiation force impulse with FibroScan (r = 0.
920; P < 0.001).The vertical line represents the cut-off value of 13 kPa for FS and the horizontal line represents the cut-off value of 1.60 m/s for acoustic radiation force impulse (n = 482); using the cut-off value of 1.60 for the discrimination of liver fibrosis from liver cirrhosis for acoustic radiation force impulse imaging shear wave velocity, 458 of the 482 patients (95.1%) were classified correctly. Six (1.2%) patients were classified false-negative (FS-LS ≥ 13 kPa and acoustic radiation force impulse imaging shear wave velocity < 1.60 m/s), and 18 (3.7%) were classified false-positive (FS-LS < 13 kPa and ARFI-SWV ≥1.60 m/s. FS: FibroScan©.
- Citation: Kircheis G, Sagir A, Vogt C, vom Dahl S, Kubitz R, Häussinger D. Evaluation of acoustic radiation force impulse imaging for determination of liver stiffness using transient elastography as a reference. World J Gastroenterol 2012; 18(10): 1077-1084
- URL: https://www.wjgnet.com/1007-9327/full/v18/i10/1077.htm
- DOI: https://dx.doi.org/10.3748/wjg.v18.i10.1077


