Copyright
©2012 Baishideng Publishing Group Co.
World J Gastroenterol. Jan 7, 2012; 18(1): 34-43
Published online Jan 7, 2012. doi: 10.3748/wjg.v18.i1.34
Published online Jan 7, 2012. doi: 10.3748/wjg.v18.i1.34
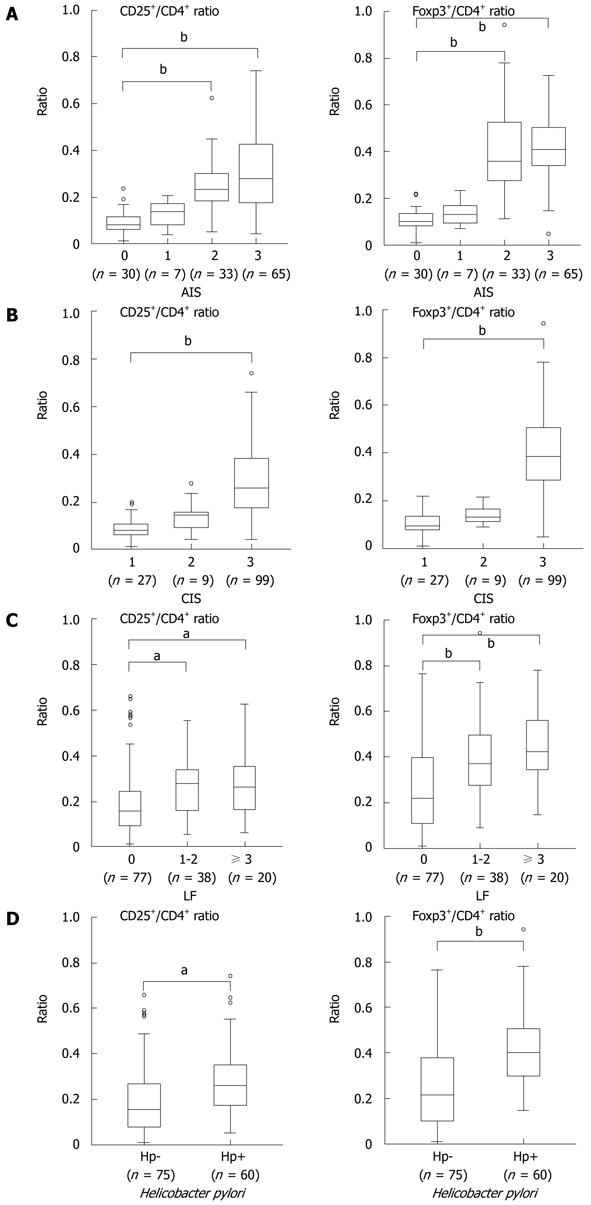
Figure 4 Box plots for the ratio of CD25+/CD4+ and of Foxp3+/CD4+ according to acute inflammatory score, chronic inflammatory score, lymphoid follicle number, and Helicobacter pylori infection.
Box plots for the ratio of CD25+/CD4+ and of Foxp3+/CD4+ according to A: Acute inflammatory score (AIS); B: Chronic inflammatory score (CIS); C: Lymphoid follicle number (LF); D: Helicobacter pylori infection. Data were analyzed using the Mann-Whitney U test. aP < 0.05 and bP < 0.001. HP: Helicobacter pylori.
- Citation: Cheng HH, Tseng GY, Yang HB, Wang HJ, Lin HJ, Wang WC. Increased numbers of Foxp3-positive regulatory T cells in gastritis, peptic ulcer and gastric adenocarcinoma. World J Gastroenterol 2012; 18(1): 34-43
- URL: https://www.wjgnet.com/1007-9327/full/v18/i1/34.htm
- DOI: https://dx.doi.org/10.3748/wjg.v18.i1.34


