Copyright
©2012 Baishideng Publishing Group Co.
World J Gastroenterol. Jan 7, 2012; 18(1): 34-43
Published online Jan 7, 2012. doi: 10.3748/wjg.v18.i1.34
Published online Jan 7, 2012. doi: 10.3748/wjg.v18.i1.34
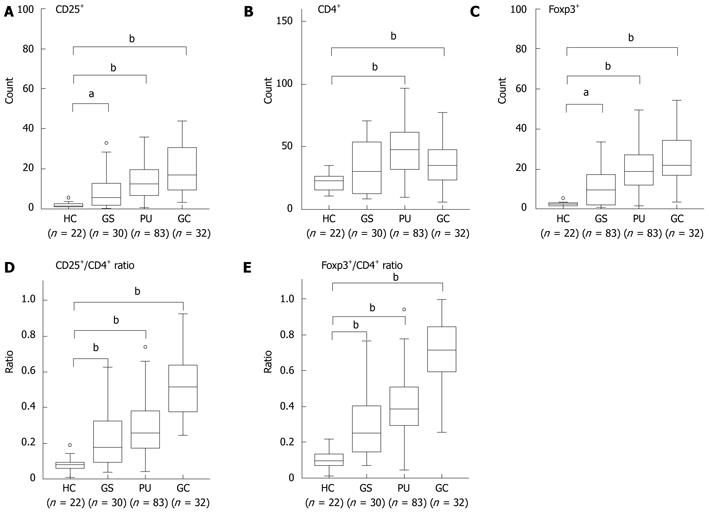
Figure 3 Box plots for the number of CD25+, CD4+, and Foxp3+ cells, and the ratio of CD25+/CD4+ and Foxp3+/CD4+ in healthy controls, gastritis, peptic ulcer, and gastric cancer.
Box plots for A: The number of CD25+ cells; B: The number of CD4+ cells; C: The number of Foxp3+ cells; D: The ratio of CD25+/CD4+; E: The ratio of Foxp3+/CD4+ in non-intestinal metaplasia areas of antral gastric mucosa from healthy controls (HC) and patients with gastritis (GS), peptic ulcer (PU), and gastric cancer (GC). Data were analyzed by the Mann-Whitney U test. aP < 0.05 and bP < 0.001.
- Citation: Cheng HH, Tseng GY, Yang HB, Wang HJ, Lin HJ, Wang WC. Increased numbers of Foxp3-positive regulatory T cells in gastritis, peptic ulcer and gastric adenocarcinoma. World J Gastroenterol 2012; 18(1): 34-43
- URL: https://www.wjgnet.com/1007-9327/full/v18/i1/34.htm
- DOI: https://dx.doi.org/10.3748/wjg.v18.i1.34


