Copyright
©2011 Baishideng Publishing Group Co.
World J Gastroenterol. Mar 7, 2011; 17(9): 1160-1166
Published online Mar 7, 2011. doi: 10.3748/wjg.v17.i9.1160
Published online Mar 7, 2011. doi: 10.3748/wjg.v17.i9.1160
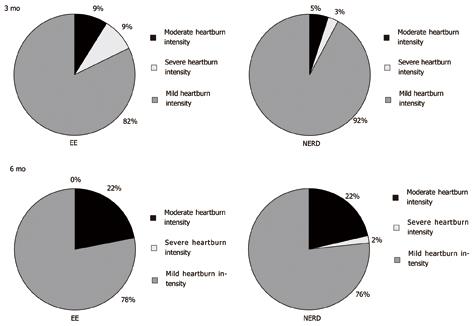
Figure 2 Distribution of heartburn intensity at 3 mo (top panels) and 6 mo (bottom panels) therapy in erosive esophagitis (left panels) and non erosive reflux disease patiens (right panels).
EE: Erosive esophagitis; NERD: Non erosive reflux disease.
- Citation: Pace F, Riegler G, Leone A, Dominici P, Grossi E, Group TES. Gastroesophageal reflux disease management according to contemporary international guidelines: A translational study. World J Gastroenterol 2011; 17(9): 1160-1166
- URL: https://www.wjgnet.com/1007-9327/full/v17/i9/1160.htm
- DOI: https://dx.doi.org/10.3748/wjg.v17.i9.1160


