Copyright
©2011 Baishideng Publishing Group Co.
World J Gastroenterol. Mar 7, 2011; 17(9): 1152-1159
Published online Mar 7, 2011. doi: 10.3748/wjg.v17.i9.1152
Published online Mar 7, 2011. doi: 10.3748/wjg.v17.i9.1152
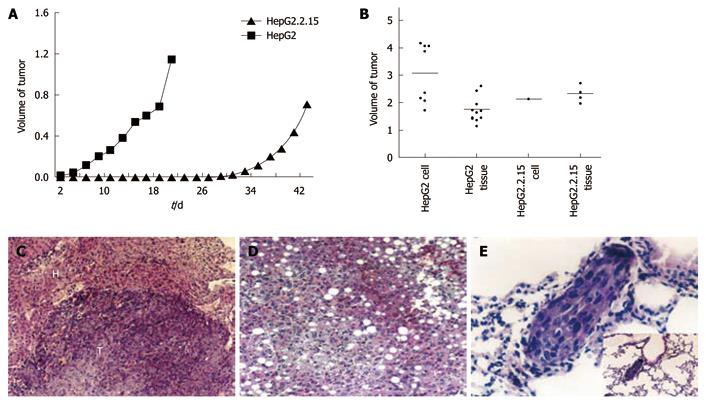
Figure 4 Tumor formation of HepG2 and HepG2.
2.15 cells in vivo. A: The volume of subcutaneous tumors were measured and recorded every 2 d. The difference of tumor growth rate between HepG2 and HepG2.2.15 groups was significant (P < 0.01, Mann-Whithey U test); B: Tumor development in four groups in vivo; C: Expansive growth of tumor. The boundary of tumor and normal tissue is clear [hematoxylin and eosin (HE) stain, × 120]. T: Tumor; H: Liver tissue; D: Fatty changes in liver tissue of HepG2.2.15 groups (HE stain, × 120); E: Lung metastasis in HepG2 injected group (HE stain, × 460) and low power field.
- Citation: Zhao R, Wang TZ, Kong D, Zhang L, Meng HX, Jiang Y, Wu YQ, Yu ZX, Jin XM. Hepatoma cell line HepG2.2.15 demonstrates distinct biological features compared with parental HepG2. World J Gastroenterol 2011; 17(9): 1152-1159
- URL: https://www.wjgnet.com/1007-9327/full/v17/i9/1152.htm
- DOI: https://dx.doi.org/10.3748/wjg.v17.i9.1152


