Copyright
©2011 Baishideng Publishing Group Co.
World J Gastroenterol. Mar 7, 2011; 17(9): 1152-1159
Published online Mar 7, 2011. doi: 10.3748/wjg.v17.i9.1152
Published online Mar 7, 2011. doi: 10.3748/wjg.v17.i9.1152
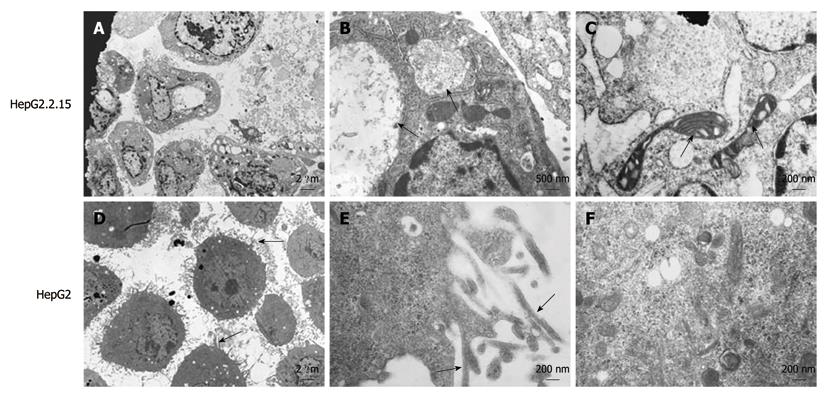
Figure 1 Ultrastructure of HepG2.
2.15 and HepG2 cells. A: Filopodia disappearance in HepG2.2.15 cells (EM × 2500); B: Viral inclusion bodies in the cytoplasm of HepG2.2.15 cells. Arrows indicate the viral inclusion bodies (EM × 15 000); C: Arrows indicate degenerated mitochondria (EM × 25 000); D: Plentiful filopodia around HepG2 cells. Arrows indicate filopodia (EM × 2500); E: Microfilament appearance in filopodia in HepG2 cells in high power field. Arrows indicate microfilament (EM × 25 000); F: Abundant organelles in the cytoplasm of HepG2 cells (EM × 25 000).
- Citation: Zhao R, Wang TZ, Kong D, Zhang L, Meng HX, Jiang Y, Wu YQ, Yu ZX, Jin XM. Hepatoma cell line HepG2.2.15 demonstrates distinct biological features compared with parental HepG2. World J Gastroenterol 2011; 17(9): 1152-1159
- URL: https://www.wjgnet.com/1007-9327/full/v17/i9/1152.htm
- DOI: https://dx.doi.org/10.3748/wjg.v17.i9.1152


