Copyright
©2011 Baishideng Publishing Group Co.
World J Gastroenterol. Feb 28, 2011; 17(8): 987-995
Published online Feb 28, 2011. doi: 10.3748/wjg.v17.i8.987
Published online Feb 28, 2011. doi: 10.3748/wjg.v17.i8.987
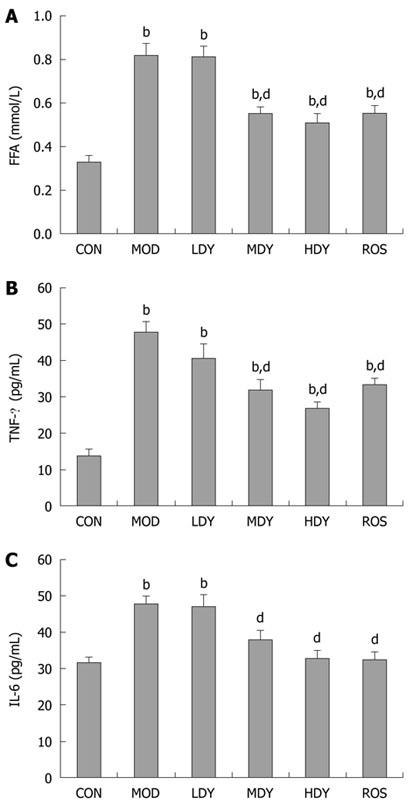
Figure 3 Free fatty acid and adipocytokines in diabetic rats after 8 wk treatment.
A: Values of free fatty acid (FFA) in diabetes after 8 wk treatment; B: Values of tumor necrosis factor-α (TNF-α) in diabetes after 8 wk treatment; C: Values of interleukin-6 (IL-6) in diabetes after 8 wk treatment. CON: Control group; MOD: Type 2 diabetes model group; LDY: Low-dose Yi-Qi-Zeng-Min-Tang (YQZMT) group; MDY: Medium-dose YQZMT group; HDY: High-dose YQZMT group; ROS: Rosiglitazone group. Bar graphs indicate mean ± SE. bP < 0.01 vs CON group; dP < 0.01 vs MOD group.
- Citation: Zhang Z, Xue HL, Liu Y, Wang WJ. Yi-Qi-Zeng-Min-Tang, a Chinese medicine, ameliorates insulin resistance in type 2 diabetic rats. World J Gastroenterol 2011; 17(8): 987-995
- URL: https://www.wjgnet.com/1007-9327/full/v17/i8/987.htm
- DOI: https://dx.doi.org/10.3748/wjg.v17.i8.987


